Welcome back to What Is Probability?! We are now on lesson 2 of 4 in this course, and we are making solid progress. In the previous lesson, we built the essential vocabulary of probability: outcomes, sample spaces, and events, giving us a precise way to describe what can happen in a chance process. Now it is time to take things further and ask: how likely is any given event to occur?
We already have intuitive ways of describing likelihood. We say a raffle win is "practically impossible," that a coin flip is "50/50," or that a summer thunderstorm is "very unlikely." The trouble is that words like "likely" or "unlikely" mean different things to different people. Mathematics needs something more reliable: a single, shared numerical scale that anyone can use and interpret the same way.
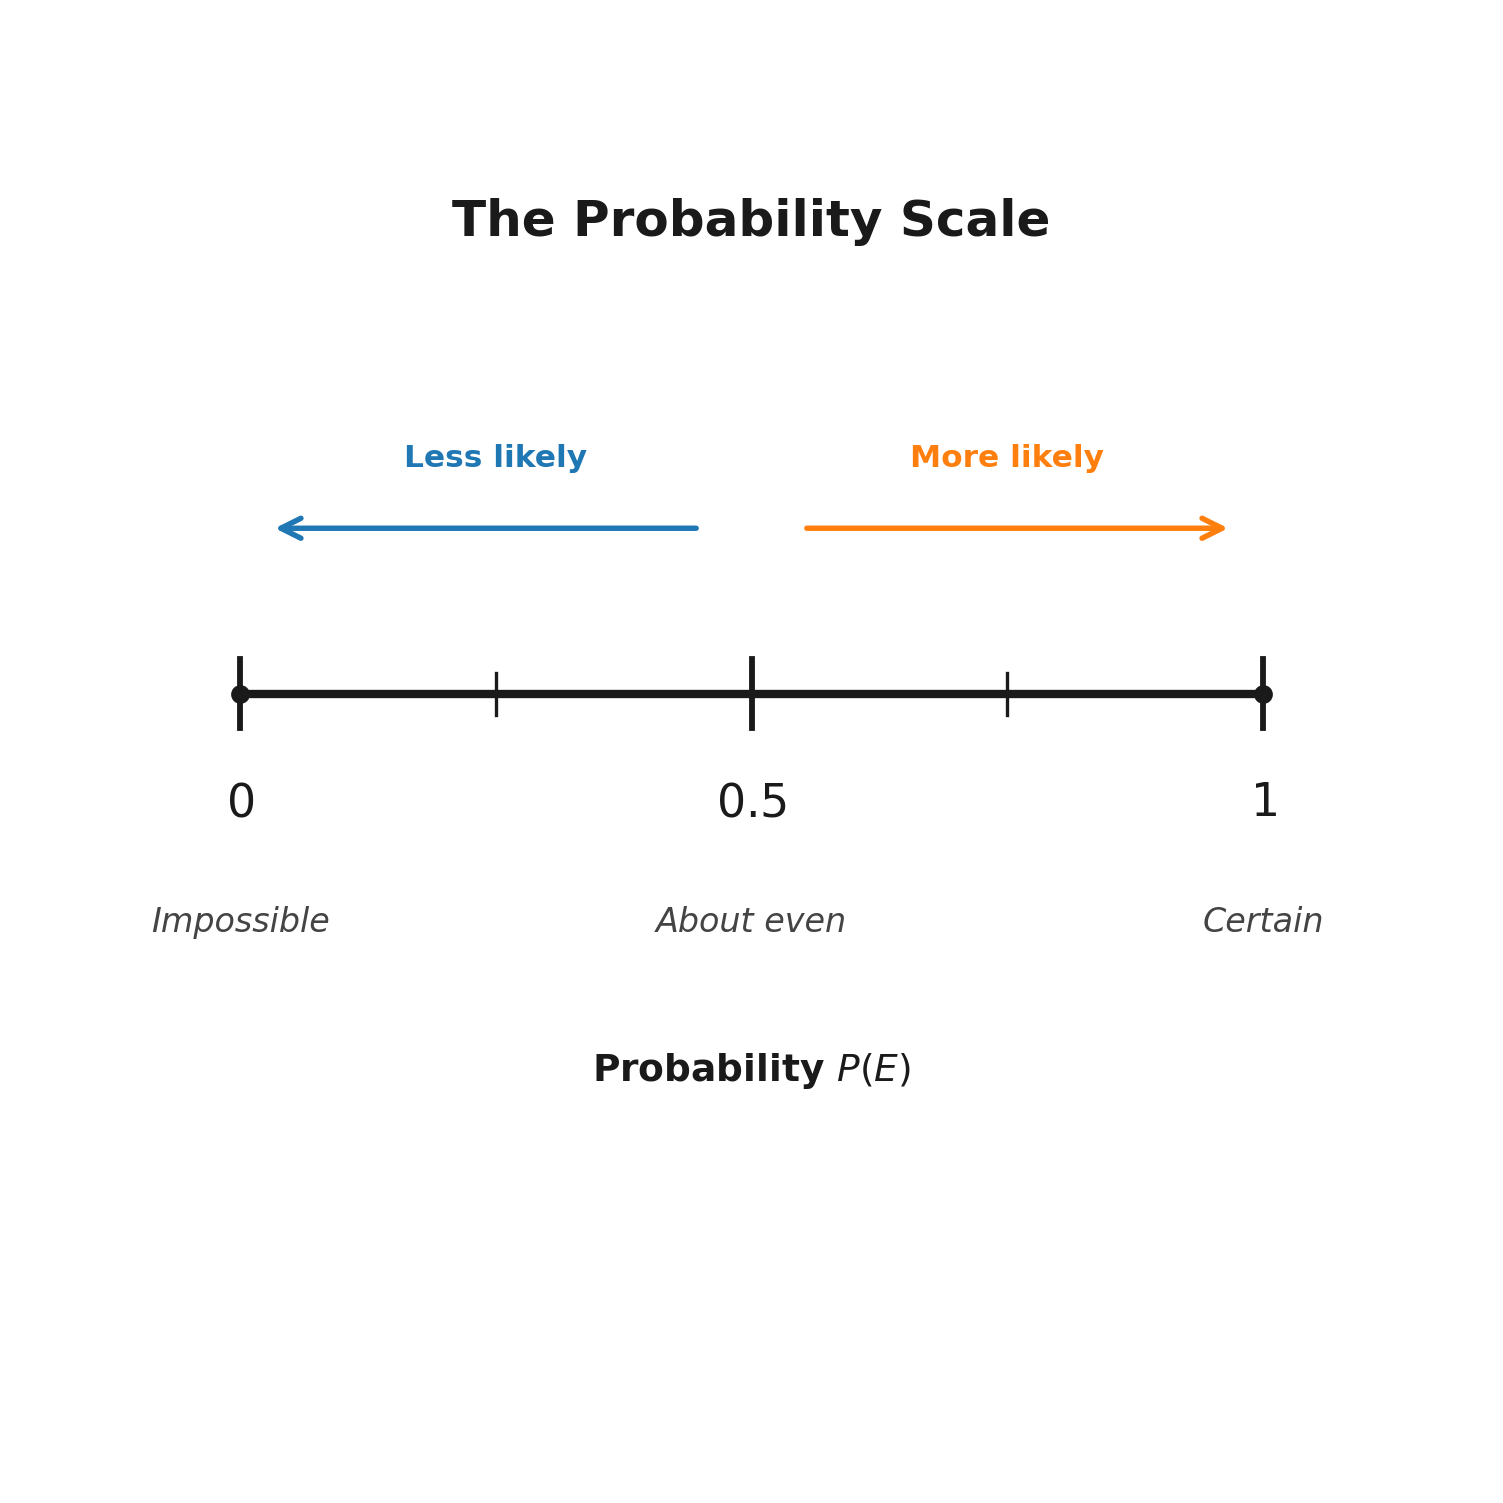
The probability scale is a number line that runs from to . The probability of an event , written as , is always a number in this range:
The two ends of the scale carry clear, precise meanings:
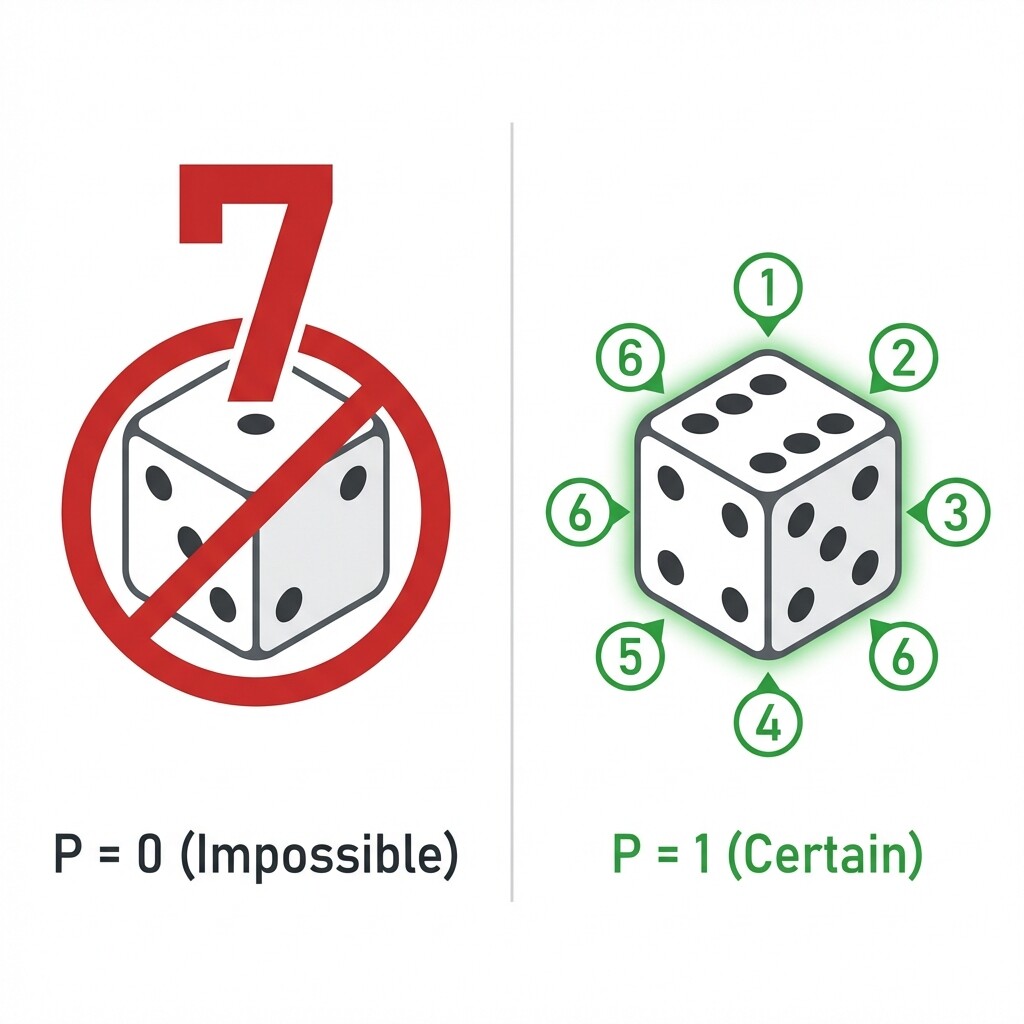
- — the event is impossible. It cannot happen under any circumstances. Rolling a 7 on a standard six-sided die is a good example: there is no face showing 7, so .
- — the event is . It is guaranteed to happen every time. Rolling number between 1 and 6 on that same die is certain: .
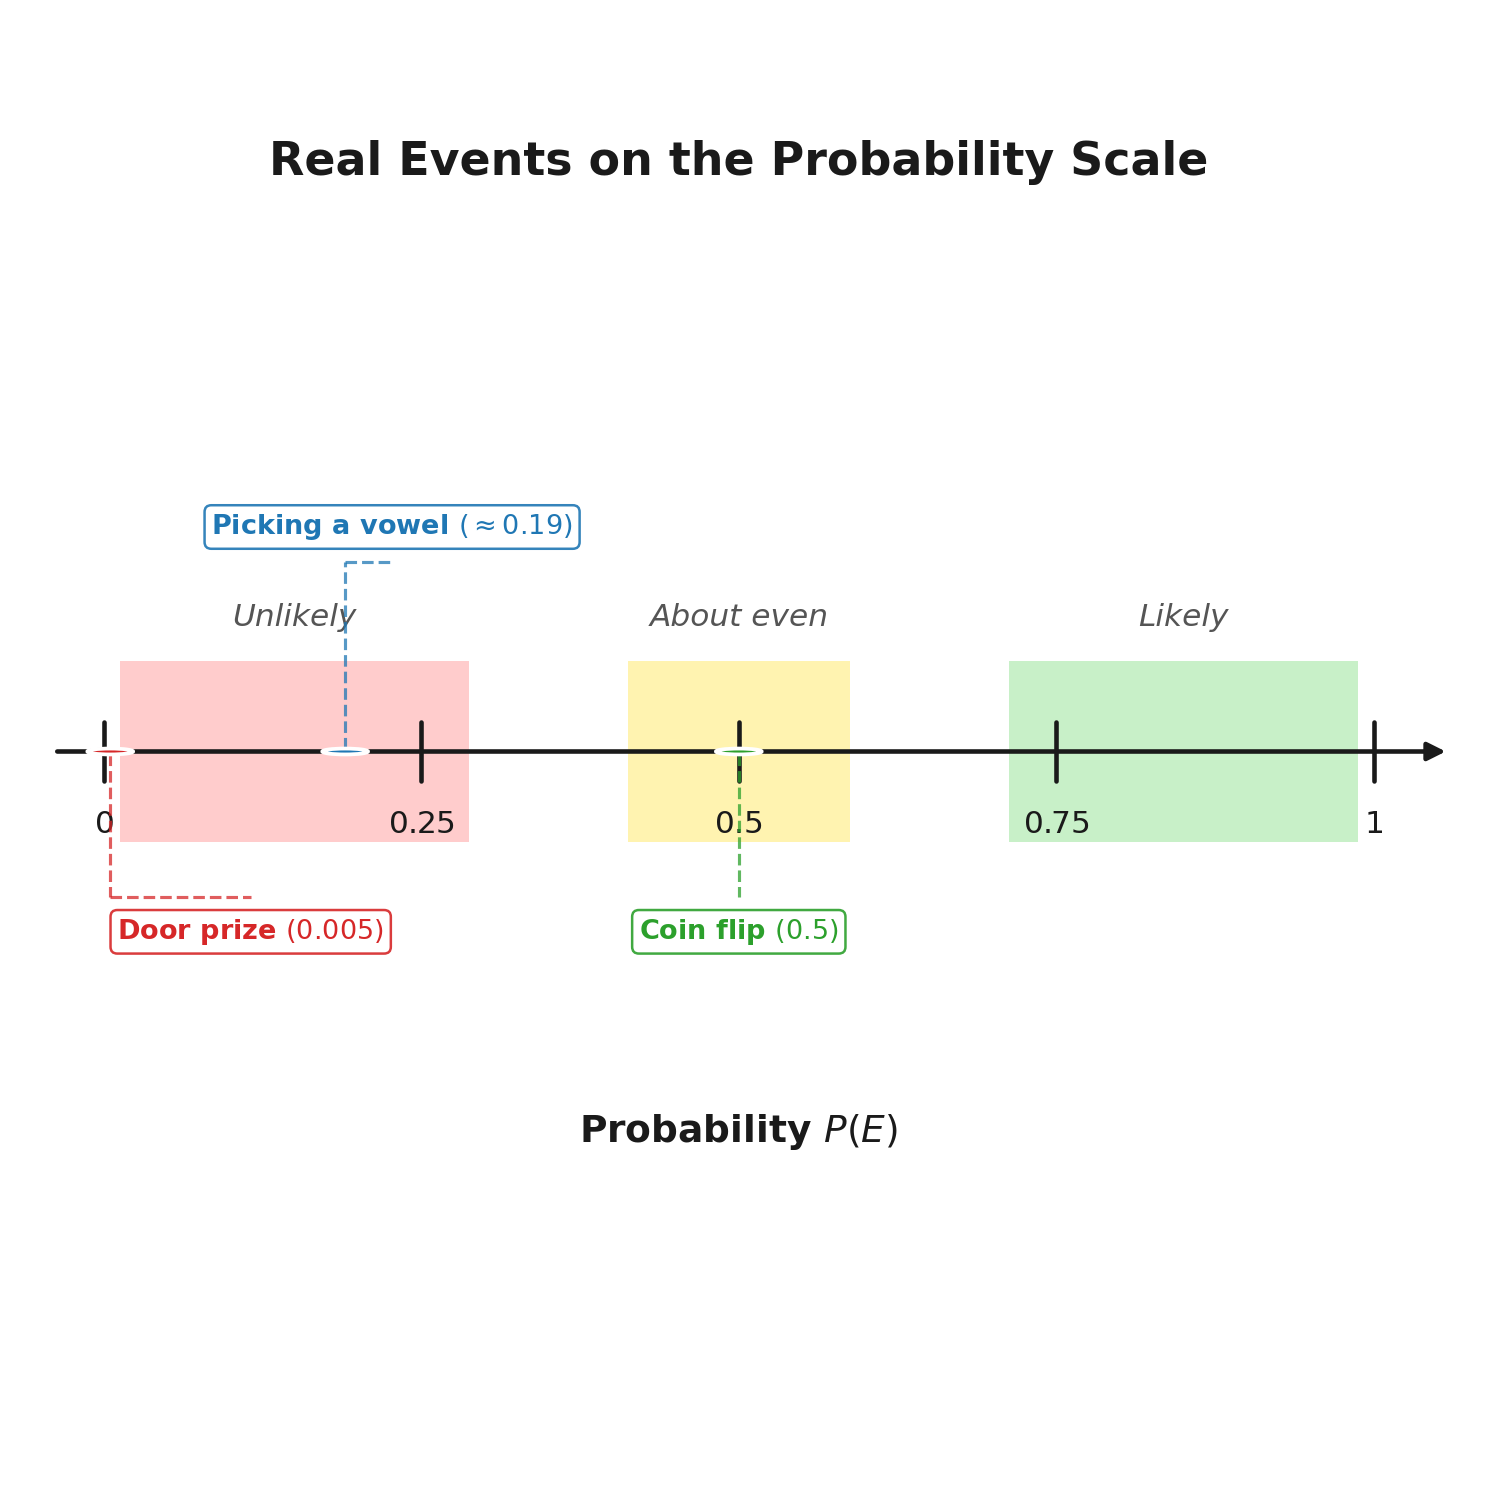
Between and , three key regions help us interpret probabilities at a glance:
Let's bring the scale to life with a few concrete examples!
You do not need to worry about how these exact numbers are calculated yet. For now, focus on what the numbers mean on the probability scale; we will learn the calculation method in detail in future units.
- Winning a door prize when holding 1 ticket out of 200. This is possible, but very unlikely. The probability is , sitting extremely close to .
- Picking a vowel at random from the English alphabet. With 5 vowels out of 26 letters, . This still falls close to , so it belongs in the unlikely region.
In this lesson, we introduced the probability scale: a number line from to that assigns a precise likelihood value to every event. A probability of signals an impossible event, while a probability of signals a certain one. Values near indicate unlikely events, values near indicate events that are about equally likely to happen or not, and values near indicate likely events.