Picture a fundraiser where dozens of folded paper tickets are shuffled in a drum before a single name is drawn. Every ticket-holder feels the same mix of hope and suspense because each ticket seems to have the same chance. That everyday intuition is exactly what today's lesson formalizes. Building directly on the probability scale from last time, let's answer this focused question: When are all outcomes equally likely, and what probability does each one receive?
Fairness is something we recognize almost instinctively. When a referee flips a coin to decide who kicks off a match, both teams accept the result without complaint because neither side has an advantage — the coin gives heads and tails the same chance. This shared, intuitive sense of fairness is exactly what the phrase equally likely outcomes captures in probability: when every outcome in a sample space has the same chance of occurring, we call those outcomes equally likely.
The challenge is that not every situation is as obviously fair as a coin flip. To use the concept reliably, we need a clear way to decide whether a given process actually produces equally likely outcomes, rather than simply assuming it does.
The key question to ask is: does the structure of the process treat every outcome the same way? When it does, the outcomes are equally likely. Here are the most reliable structural clues to look for:
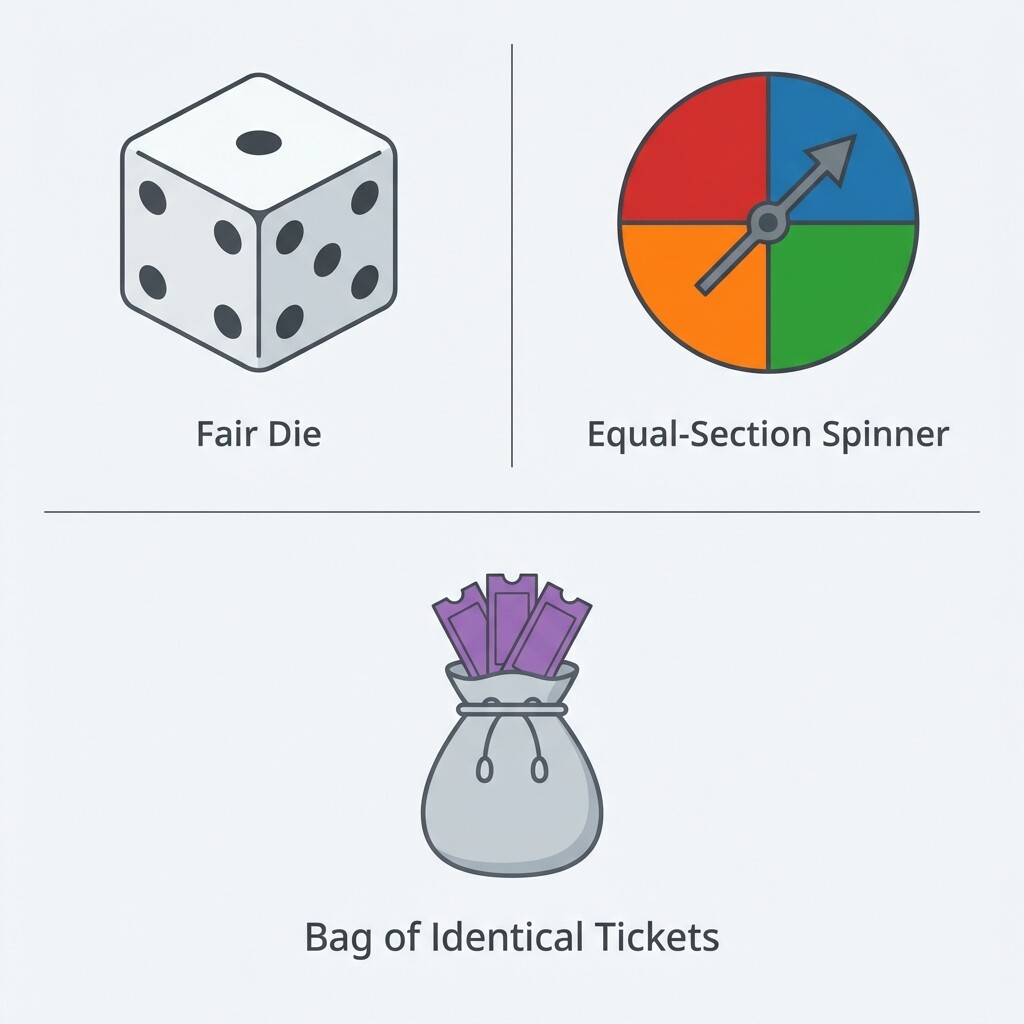
- Physical symmetry: A fair six-sided die has six faces of identical size and shape, giving each face an equal chance of landing face-up. A fair coin has two sides of matching size and weight.
- Identical items in a collection: A bag containing 10 tickets of the same size and shape gives every ticket the same chance of being drawn.
- Equal sections on a spinner: A spinner divided into equal sections gives each section the same area, so the needle is just as likely to stop on any one section as on any other.
When these features are present, you can confidently conclude that the outcomes are equally likely.
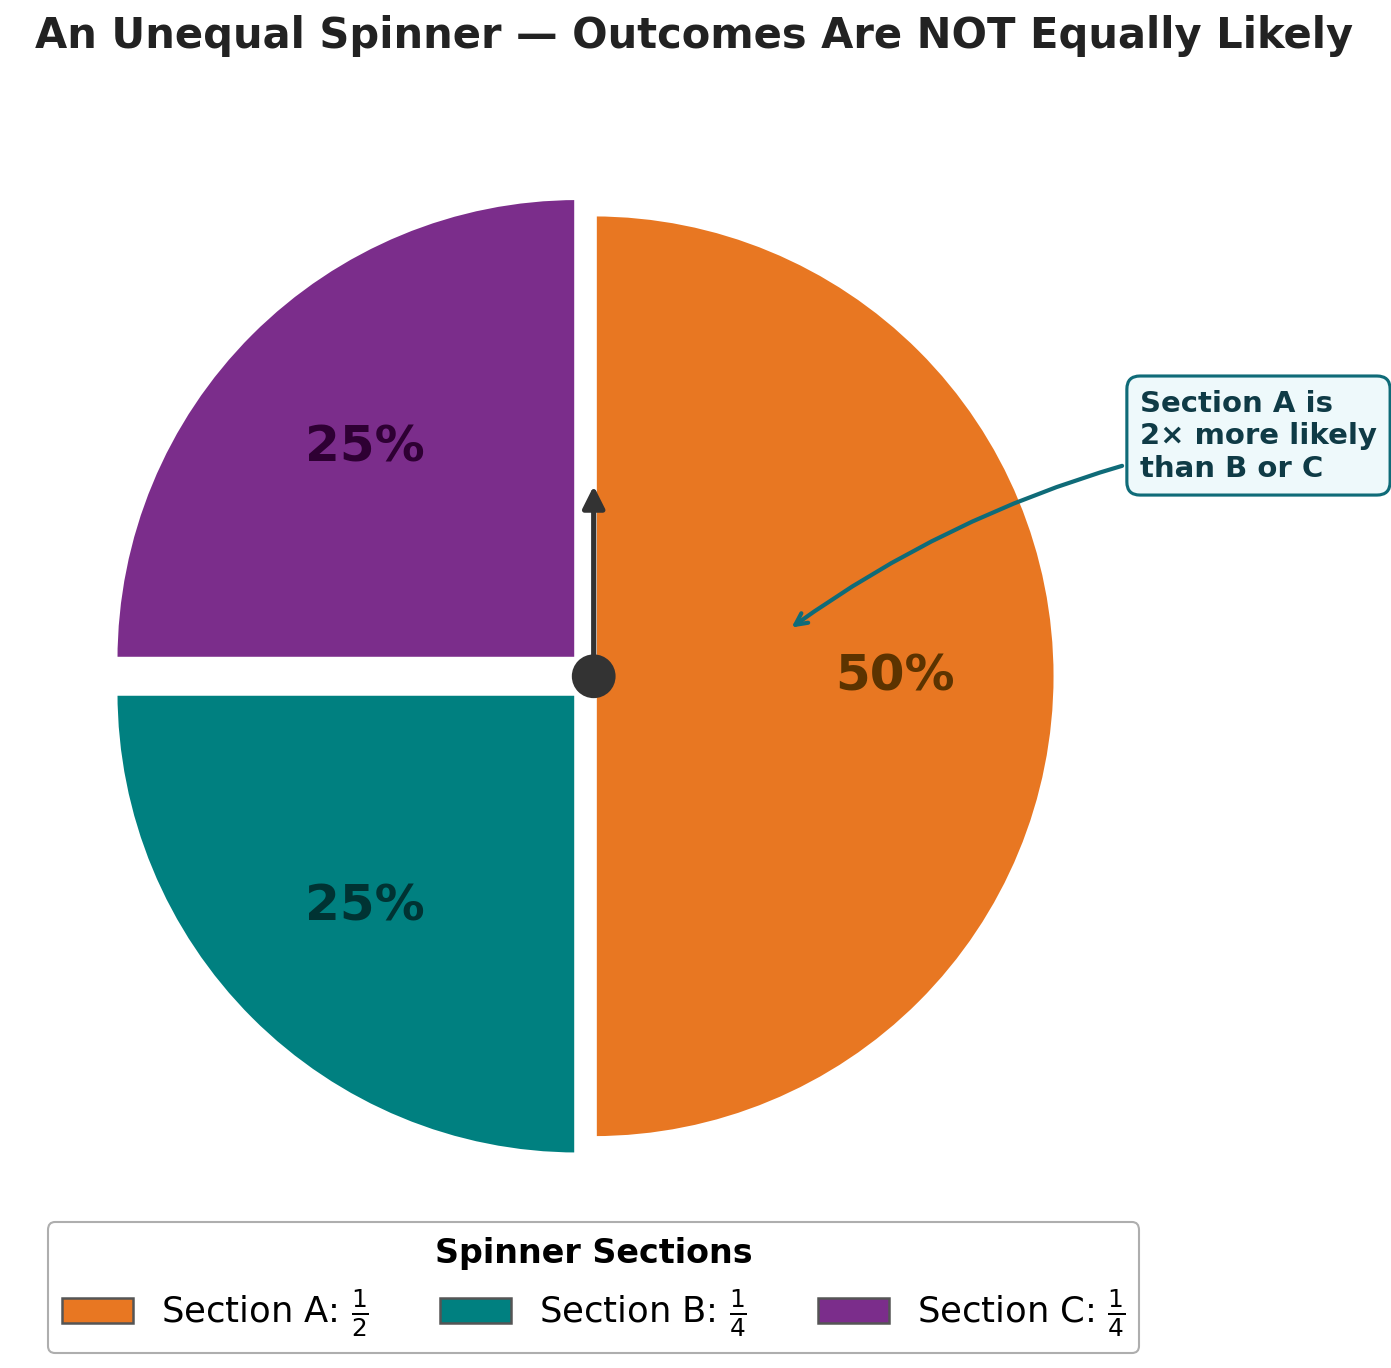
Not every chance process is built this way. Consider a spinner divided into three sections where one section covers half the wheel and the other two split the remaining half equally. The large section will come up far more often than either small one, so the three outcomes are not equally likely, even though there are exactly three of them.
A bag holding 8 blue marbles and 2 red marbles, all the same size, is another common example if you define the outcomes by color. In that case, the color outcomes blue and red are not equally likely. Drawing blue is much more probable than drawing red because blue outnumbers red four to one. By contrast, if the outcomes are the 10 individual marbles themselves, then those outcomes are equally likely, assuming each marble is equally likely to be drawn.
The takeaway is that equal likelihood must be earned by the structure of the process. If items differ in quantity, or if sections on a spinner are unequal, you cannot treat all outcomes as equally likely — no matter how many distinct outcomes there are.
Once you confirm that a process produces equally likely outcomes, assigning probabilities becomes straightforward. If there are equally likely outcomes in the sample space, every single outcome receives the same share of the total probability:
This connects directly to the basic probability rule:
Suppose a fundraiser bag contains identical tickets numbered through , and one ticket is drawn at random. Because the tickets are identical except for their numbers, the possible outcomes are equally likely.
To find the probability of drawing ticket , count the favorable outcomes and the total outcomes:
- Favorable outcomes:
Once you know the outcomes are equally likely, the same rule applies in exactly the same way:
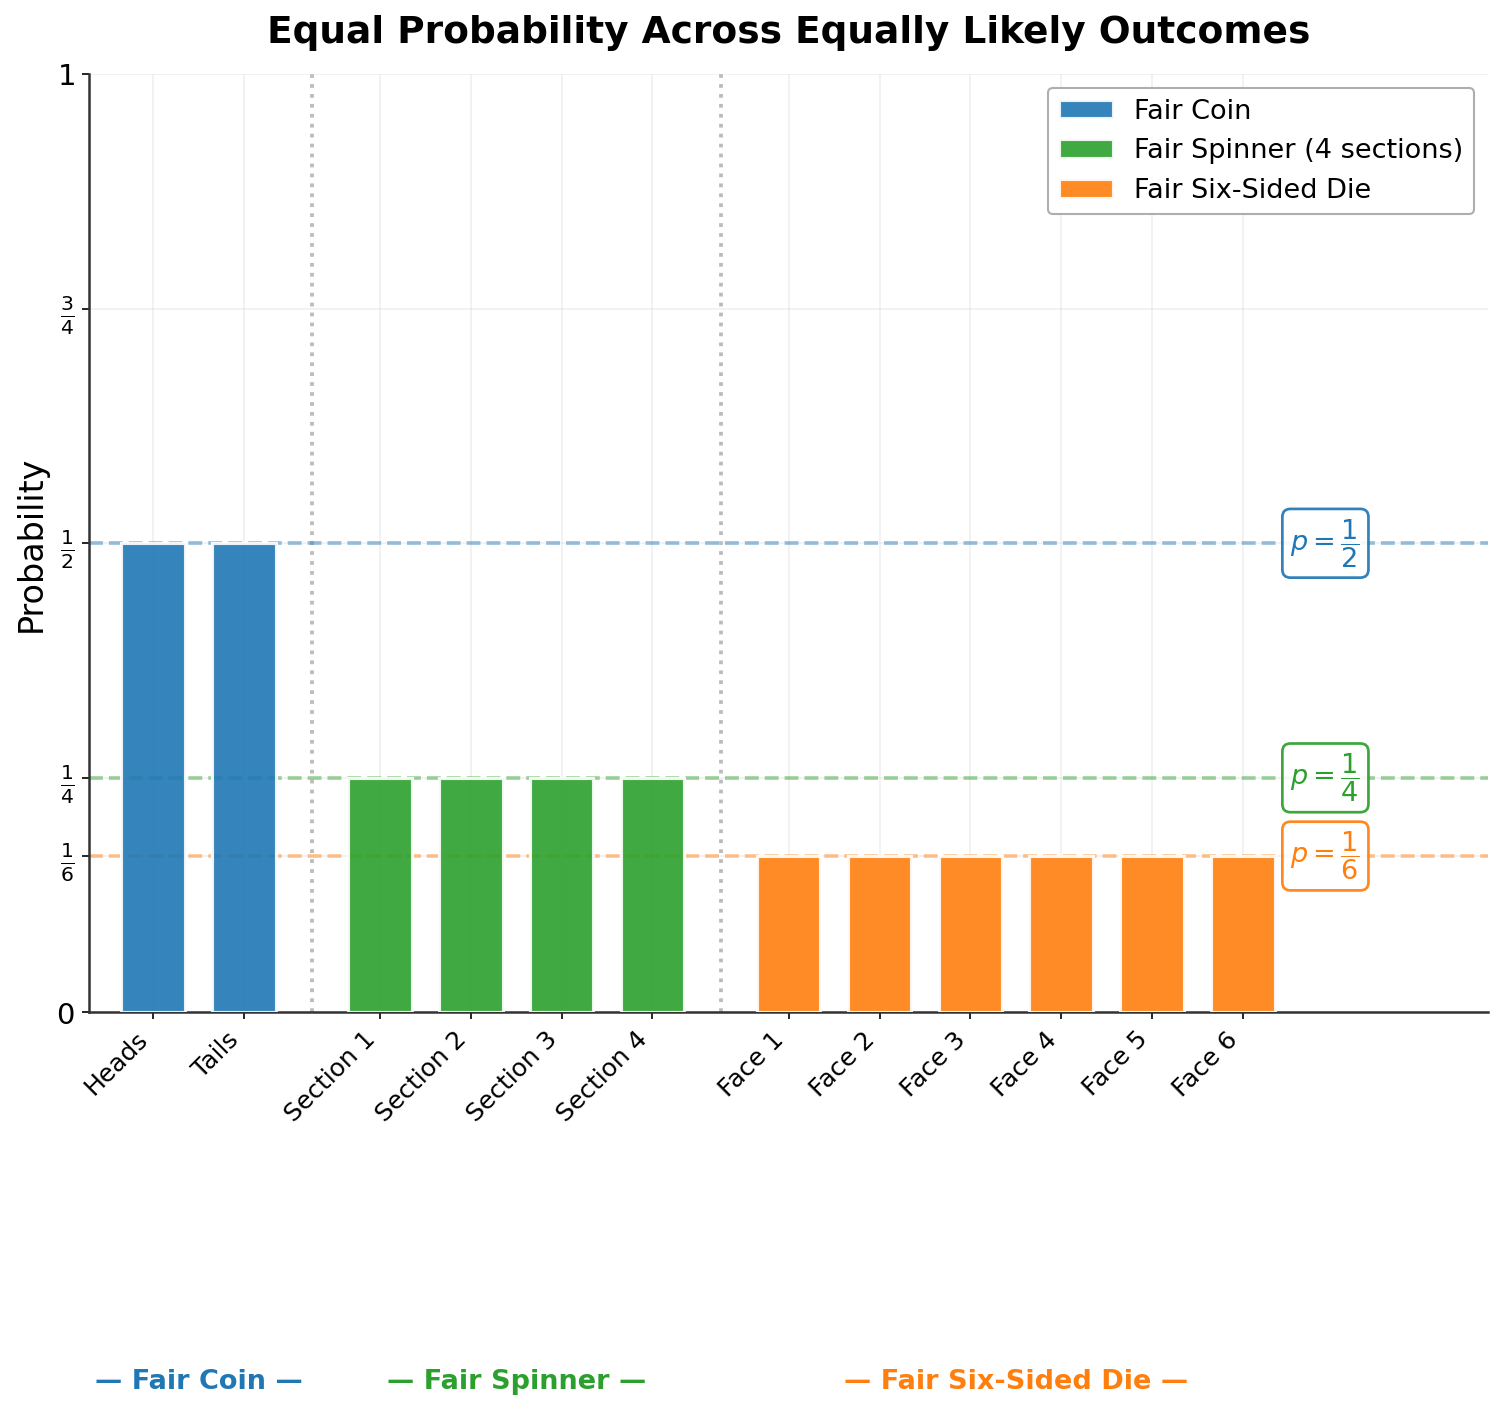
- For a fair coin, each outcome has probability .
- For a spinner divided into equal sections, each section has probability .
A fundamental rule ties everything together: when the outcomes or events you are adding describe the complete sample space — the full set of everything that could happen — their probabilities must sum to exactly .
This is true because something from the complete sample space is certain to happen. For example, when a die is rolled, one of the faces through must land on top. So the probability that some outcome from the sample space occurs is .
With equally likely outcomes, each outcome has probability , so:
In this lesson, you learned to recognize equally likely outcomes by examining the structure of a chance process: physical symmetry, identical items, and equal sections all point to equal likelihood. When those structural features are absent, you cannot assume equal probabilities. When they are present, every outcome in a sample space of size receives a probability of , and the full set of probabilities is guaranteed to sum to .
The practice section just ahead will give you the chance to apply this reasoning across a variety of real-world setups. Sharpening your eye for equally likely outcomes now will set you up well for the final lesson, where you will compute probabilities of entire events — not just individual outcomes.