Calculating Simple Event Probability
Introduction
Think of the last time you played a card game and paused to size up your odds: how many cards could actually help you, and how many are in the deck? That instinct to turn a real-world situation into a precise number is exactly what probability makes rigorous. Calculating these numbers isn't just for games; it’s how insurance companies set rates, how doctors explain the risks of a procedure, and how engineers ensure a bridge can withstand a rare storm.
Over the past three lessons, you developed the core toolkit: identifying outcomes and sample spaces, reading probabilities on the 0-to-1 scale, and recognizing when outcomes are equally likely. Now it is time to put that toolkit to work and learn how to compute the probability of a complete event, expressing the result as a fraction or decimal.
From Individual Outcomes to Events
As you may recall from the previous lesson, when a process has equally likely outcomes, each single outcome receives a probability of . In practice, however, we rarely focus on just one isolated outcome. We ask broader questions: What is the chance of rolling an even number? or What is the probability of drawing a club from a deck of cards? These questions are about events — collections of outcomes that share a common feature.
Calculating the probability of an event turns out to be a clean and natural extension of what we already know. Rather than assigning probability to one outcome at a time, we count how many outcomes match the event we are looking for and compare that count to the size of the whole sample space.
The Probability Formula
When all outcomes in a sample space are equally likely, the probability of an event is the fraction of those outcomes that make the event happen. We look at the number of ways the event can happen and divide that count by the total count of all outcomes in the sample space:
This formula applies to any simple event in any equally likely sample space, whether we are rolling a die, drawing a ticket, spinning a wheel, or picking from a bag. Two counts, one division — that is the entire method.
Counting Outcomes That Match
With the formula ready, our main task is counting carefully. The total number of outcomes is the size of the full sample space. The ways the event can happen refers to how many of those outcomes actually belong to the event we care about.
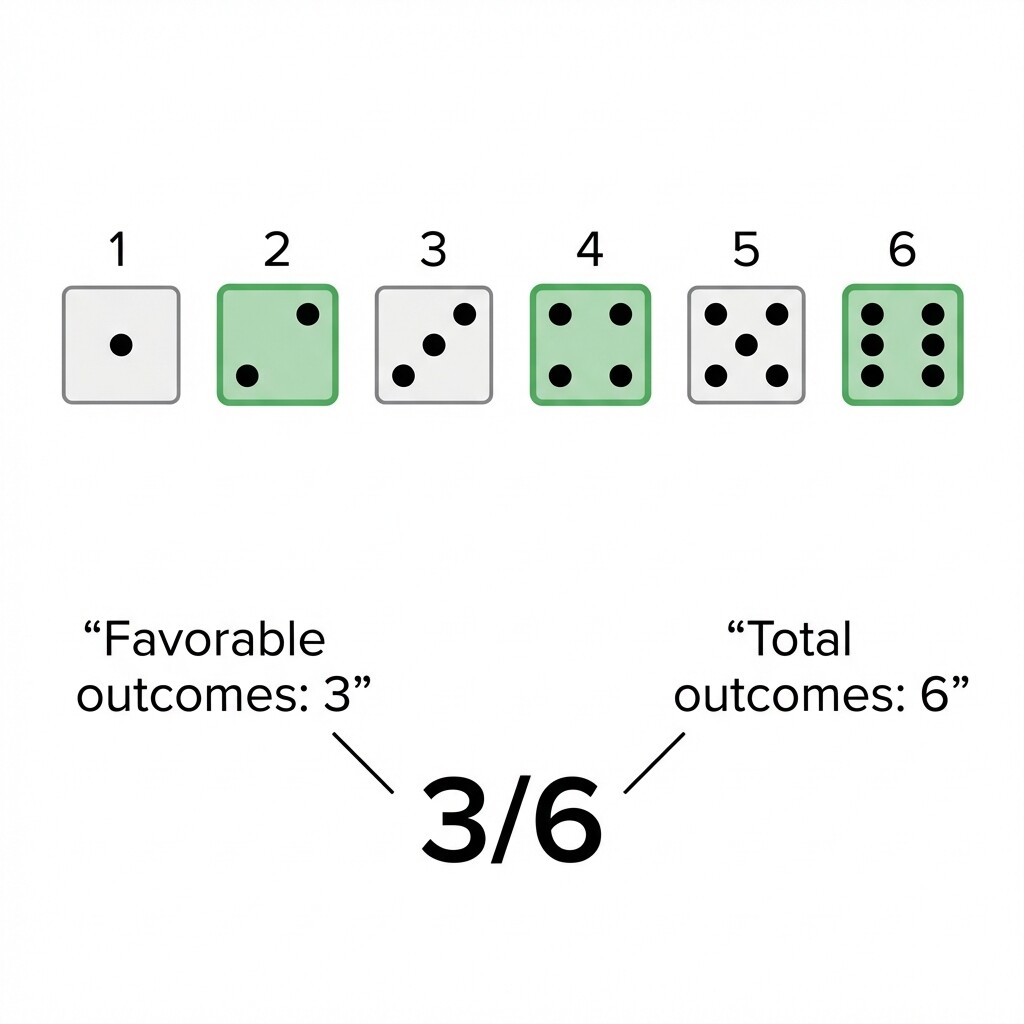
As a concrete example, suppose we roll a standard six-sided die and ask: What is the probability of getting an even number? The sample space is , giving total outcomes. The even numbers in that set are , so there are ways the event can happen. Applying the formula:
Expressing Probability as a Fraction or Decimal
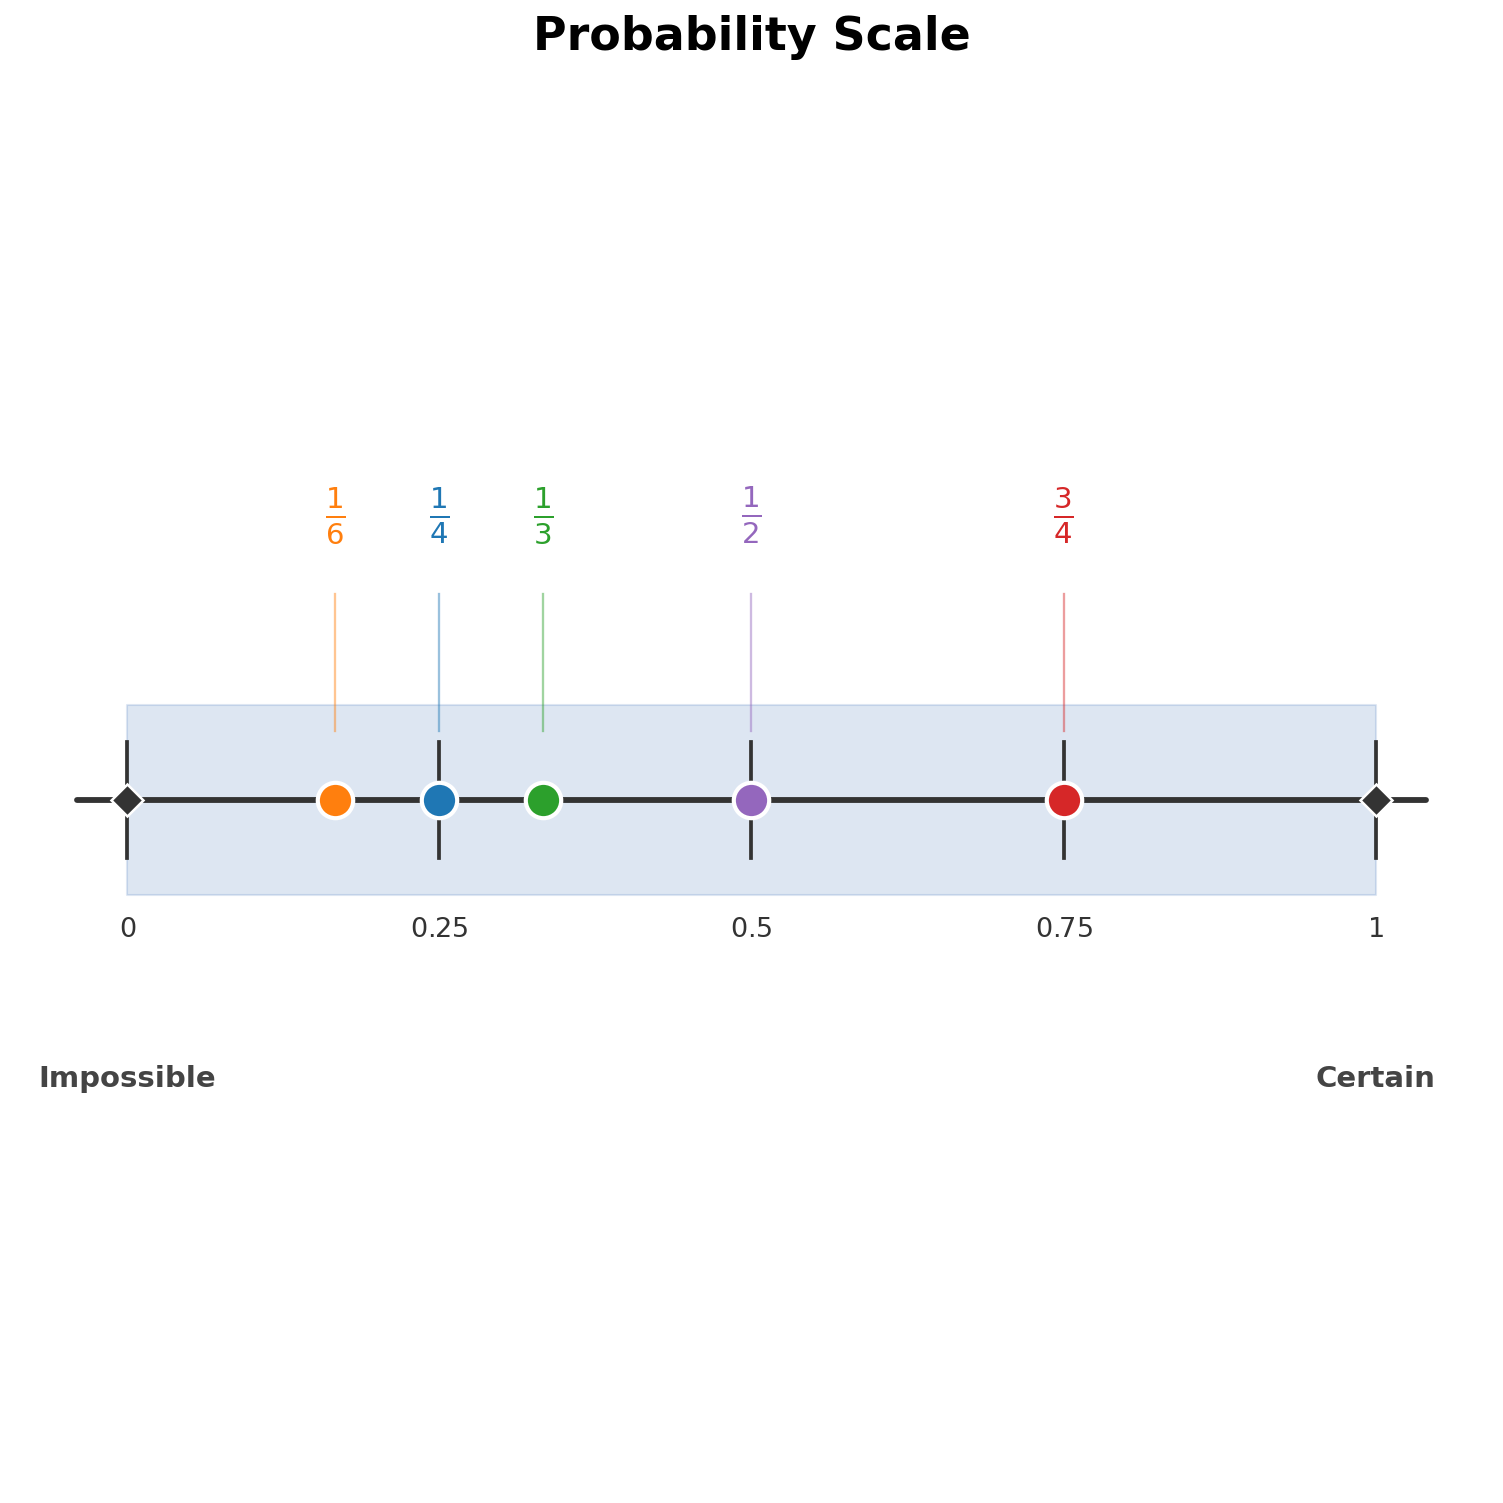
The formula produces a fraction directly, and fractions are a perfectly valid way to express a probability. We can also convert to a decimal by dividing the numerator by the denominator. For , that gives .
Here are some conversions that come up often:
| Fraction | Decimal |
|---|---|
Whichever form we use, the result must always sit between and . If it falls outside that range, there is an error in the counting, and it is worth revisiting each step.
A Step-by-Step Example
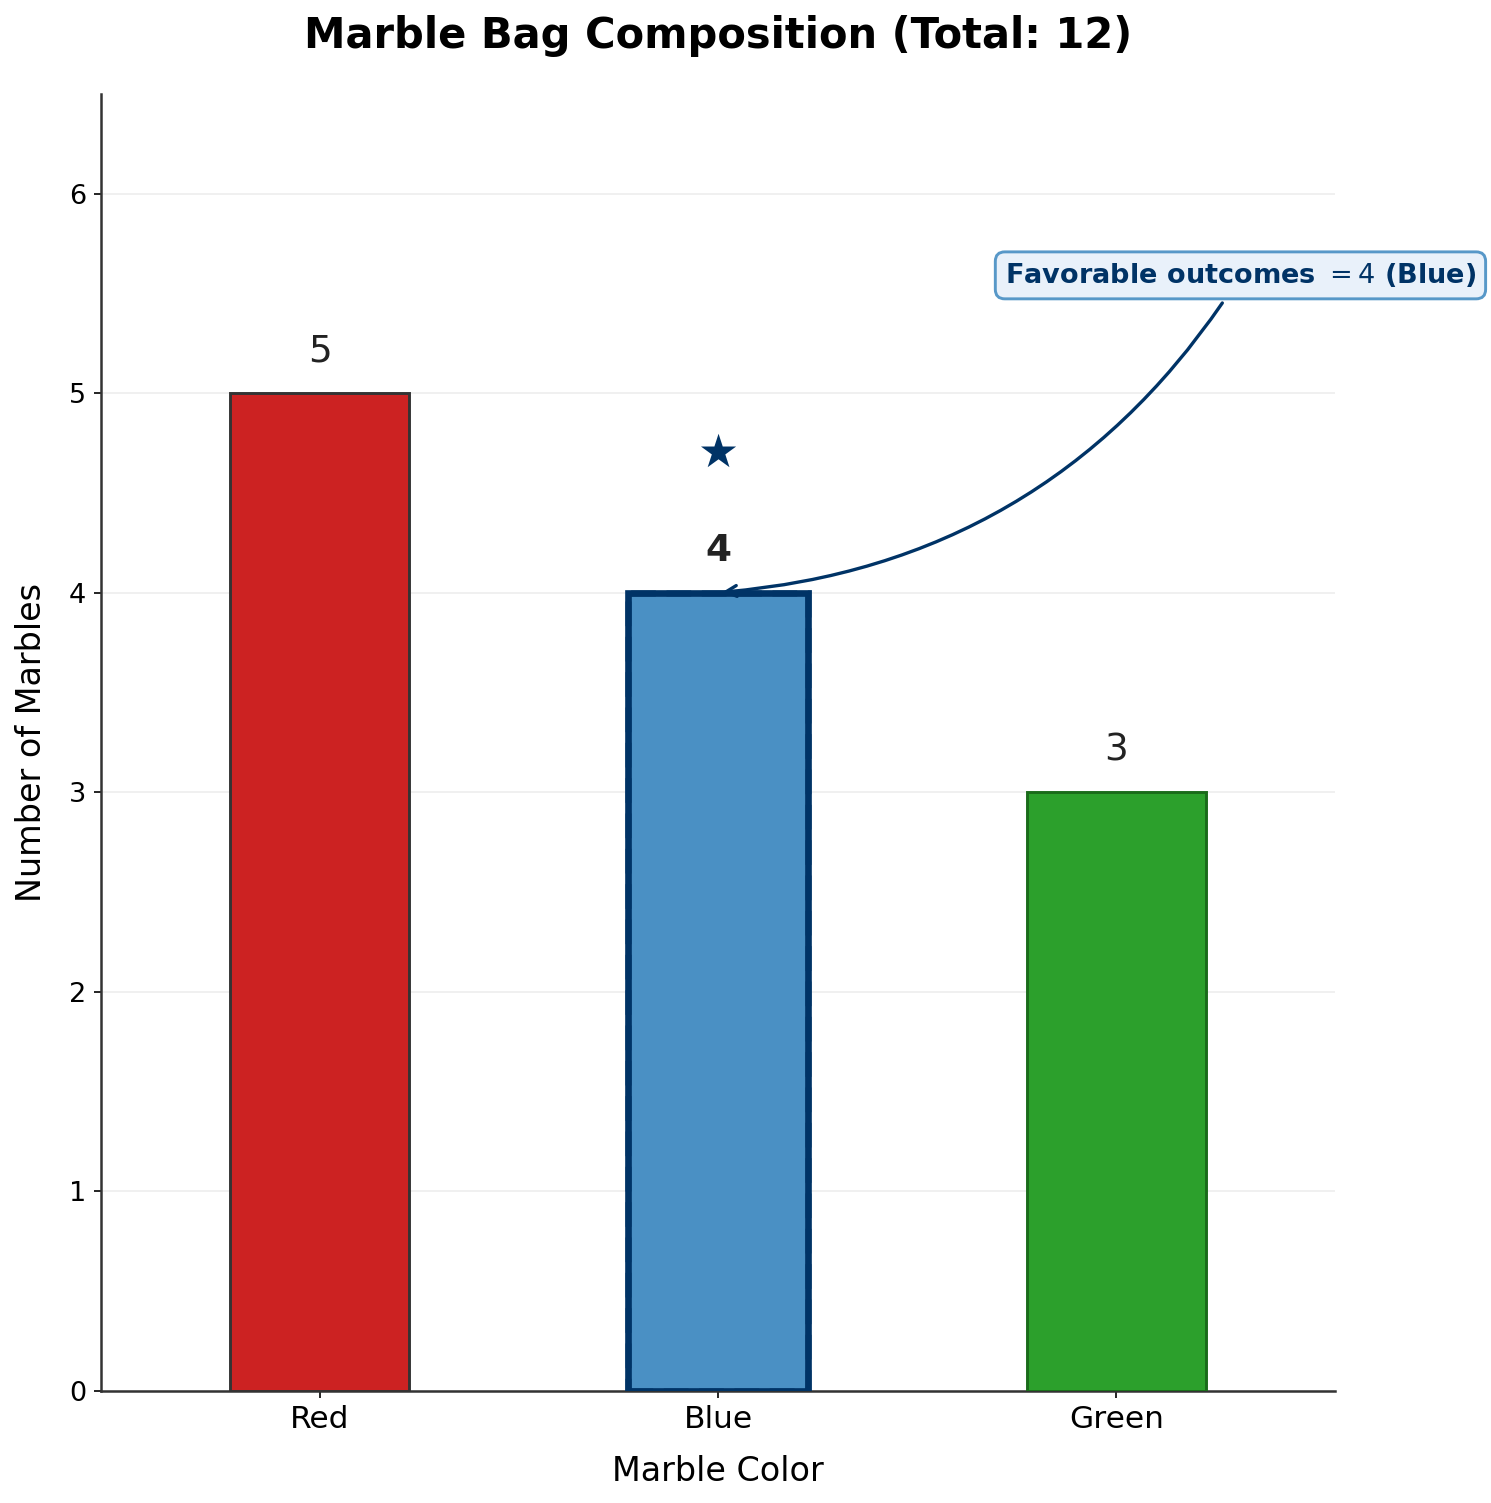
Let's work through a complete calculation. A bag holds marbles: red, blue, and green, all the same size. You win a prize if you draw a blue marble. Each marble is equally likely to be drawn. What is the probability of winning?
- Identify the total outcomes. There are marbles in total, so the sample space contains equally likely outcomes.
- Count the ways the event can happen. There are blue marbles, so outcomes match the event of "winning."
- Apply the formula.
- Check the answer. The value falls between and , and it is less than , which makes sense: blue is smaller than the combined non-blue group in the bag, so drawing blue should be less likely than not.
Two common errors to watch for: flipping the fraction (placing total outcomes in the numerator and matching outcomes in the denominator) and undercounting matching outcomes (overlooking outcomes that belong to the event). Both mistakes lead to an answer that misrepresents the true probability, so it is always worth double-checking your counts and the direction of the fraction.
Probability in the Real World
Why do we bother with these fractions? In the real world, these numbers serve as a guide for decision-making.
- Risk Assessment: If a meteorologist says there is a chance of rain, they have calculated that in 20 out of 100 similar atmospheric conditions, it rained. This helps you decide whether to carry an umbrella.
- Fairness: In a charity raffle with 500 tickets, if you buy 5 tickets, your probability of winning is or . Knowing this helps you understand the "cost of entry" versus the likelihood of the reward.
- Quality Control: A factory might test a random sample of products. If they find defects in items, the probability of a customer receiving a defective product is . This helps the company decide if they need to fix their assembly line.
By converting a vague feeling—"I might win"—into a hard number—"I have a chance"—you move from guessing to analyzing.
Conclusion and Next Steps
In this lesson, we applied the central calculation of probability: dividing the count of outcomes that match the event by the total number of equally likely outcomes to find . We also saw how to simplify fractions, convert them to decimals, and confirm that every result lands within the 0-to-1 range.
The practice exercises that follow put this formula to work across a variety of settings — from charity raffles to card decks to café tip jars. Each one is a genuine opportunity to build confidence and fluency with the method. Let's get started!
