Let's dive into Principal Component Analysis (PCA), a technique often used in machine learning to simplify complex data while keeping important details. PCA transforms datasets with many closely connected parts into datasets with parts that are not directly related to each other. Think of it as organizing a messy room and putting everything in clear, separate bins.
In this lesson, we will implement PCA step by step using C++. We will use the Eigen library for matrix operations and matplotlib-cpp for visualization. If you do not have these libraries installed, you can still follow the logic and export your results for visualization elsewhere.
First, let's create a simple 3D dataset of 150 points. In C++, we can use the standard library's random number generators and the Eigen library for matrix operations.
If you want to visualize the data, you can export it to a CSV file and use a plotting tool of your choice.
Before applying PCA, we need to standardize the dataset. This means making sure every feature (column) has an average value of 0 and a standard deviation of 1. We'll compute the mean and standard deviation for each column and adjust the data accordingly.
The next step is to calculate the covariance matrix, which tells us how much two variables change together.
Now, we need to break the covariance matrix into eigenvalues and eigenvectors. This step is essential for PCA, as it helps us find the directions (principal components) that capture the most variance in the data.
In C++, we can use the Eigen library's SelfAdjointEigenSolver for this:
To find the most important principal components, we sort the eigenvalues (and their corresponding eigenvectors) in descending order.
Now, we select the top k eigenvectors (for example, the top 2) to form a projection matrix. We then project our standardized data onto this new space.
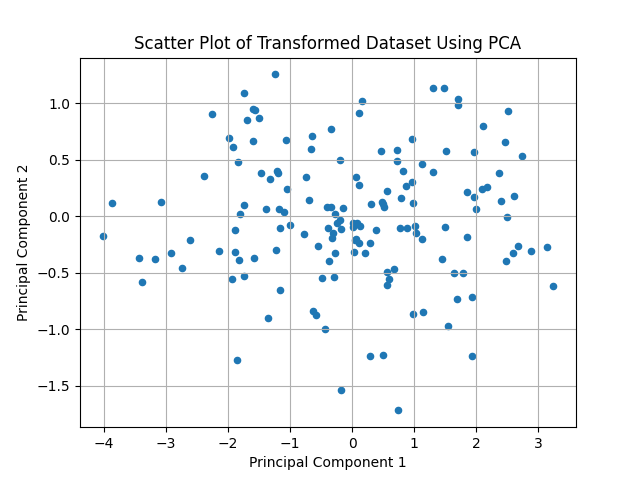
To visualize the transformed dataset, you can use a plotting library such as matplotlib-cpp. If you do not have this library, you can export the projected data to a CSV file and plot it using any external tool.
Here is how you can plot the results using matplotlib-cpp:
Plot:
Well done! You've just learned how to implement Principal Component Analysis (PCA) in C++. You created a dataset, standardized it, computed the covariance matrix, performed eigendecomposition, sorted the principal components, and projected the data onto a lower-dimensional space. This process helps simplify data while keeping its most important features.
Now it's time for you to practice! Try changing the dataset, the number of principal components, or visualizing the results in different ways. Practice is the key to mastering new concepts. Keep learning!
