Welcome back to Think Clearly About Risk in Real Life! In the first lesson, you built a toolkit for making very small probabilities feel real: you converted them into expected counts, scaled them across populations, compared unfamiliar risks to familiar ones, and translated fractional expected counts into intuitive waiting times. In this lesson, you will learn to:
Identify how the exact same risk data can sound dramatically different depending on how it is framed.
Distinguish between absolute risk and relative risk when evaluating health headlines and claims.
Calculate both absolute and relative risk changes from raw numbers.
Decide which framing provides the most useful context for making real-world personal decisions.
These tools will help you see past sneaky, alarming headlines — like a claim that a food additive "doubles your risk" — to uncover the actual size of the danger before you react.
📰 When Headlines Tell the Truth but Miss the Point
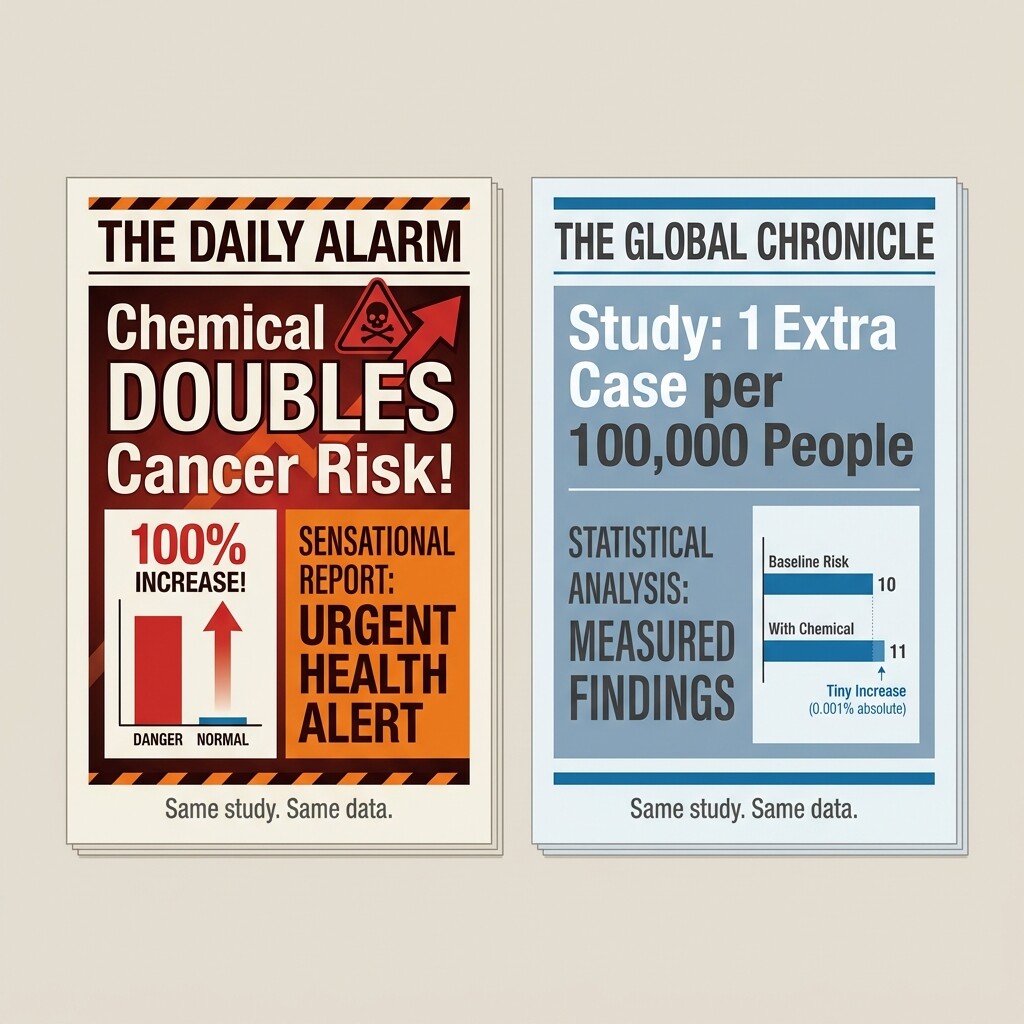
Imagine two news stories published on the same day about the same study:
Headline A: "New study finds chemical doubles cancer risk!"
Headline B: "Study links chemical to 1 extra cancer case per 100,000 people."
Both headlines are factually accurate. Yet Headline A is likely to spread faster and cause more worry because it highlights how much the risk multiplied. Headline B focuses on how much the risk actually changed in concrete terms. This distinction — between relative risk and absolute risk — is one of the most important tools for thinking clearly about any probability claim. Let's define each one precisely.
🔢 What Absolute Risk Tells Us
Absolute risk is simply the probability that an event happens, expressed as a plain number. You have been working with absolute risks throughout this learning path whenever you saw things like "1 in 10,000" or "0.03%."
When a risk changes, the absolute risk change is the straightforward difference between the new risk and the old risk:
Absolute risk change=pnew−p
🔍 What Relative Risk Tells Us
Relative risk describes how the new risk compares to the old risk as a ratio. Instead of asking "how much did the risk go up?", it asks "how many times bigger (or smaller) is the new risk?"
Relative risk=poldp
⚖️ Computing Both Framings from the Same Data
Let's walk through a second example to make the process feel routine. Suppose a medical study reports that a new drug lowers the risk of a particular side effect from 8 in 1,000 to 6 in 1,000.
Measure
Calculation
Result
Absolute risk reduction
🧭 Which Framing Should Guide Your Decision?
When you need to make a personal decision — whether to take a supplement, change a habit, or worry about a warning — start with the absolute risk change, then use the relative risk for additional context. Absolute risk directly answers the question most of us actually care about: "By how much does my chance really change?" Relative risk is useful for understanding the strength of a link between a cause and an effect, but it can exaggerate the real-world importance of that link, especially when the baseline risk is tiny.
Whenever you encounter a dramatic-sounding relative claim, you can recover the absolute picture by asking two questions:
What is the baseline risk? (If the article doesn't say, that is a red flag.)
What is the new risk? Multiply the baseline by the relative risk, or work backward from the reported percentage change.
Let's see this in action. If a headline says "treatment cuts risk by 33.33%" and you know the baseline risk is 6 in 1,000, you can find the absolute reduction:
Conclusion and Next Steps
In this lesson, you learned to distinguish absolute risk (the plain probability or its direct change) from relative risk (the ratio or percentage comparison between two probabilities). You saw that the same data can produce headlines that feel wildly different, and you practiced computing both framings from a single set of numbers. The central takeaway is straightforward: relative risk tells us how much a risk multiplied, while absolute risk tells us how much it actually moved. For personal decisions, the absolute change is almost always the more informative number.
In the upcoming exercises, you will identify framings in realistic headlines, compute absolute and relative changes from raw data, recover hidden absolute risks from relative claims, and write your own evaluation of an advertising claim. Let's put these ideas into practice!
Be a part of our community of 1M+ users who develop and demonstrate their skills on CodeSignal
old
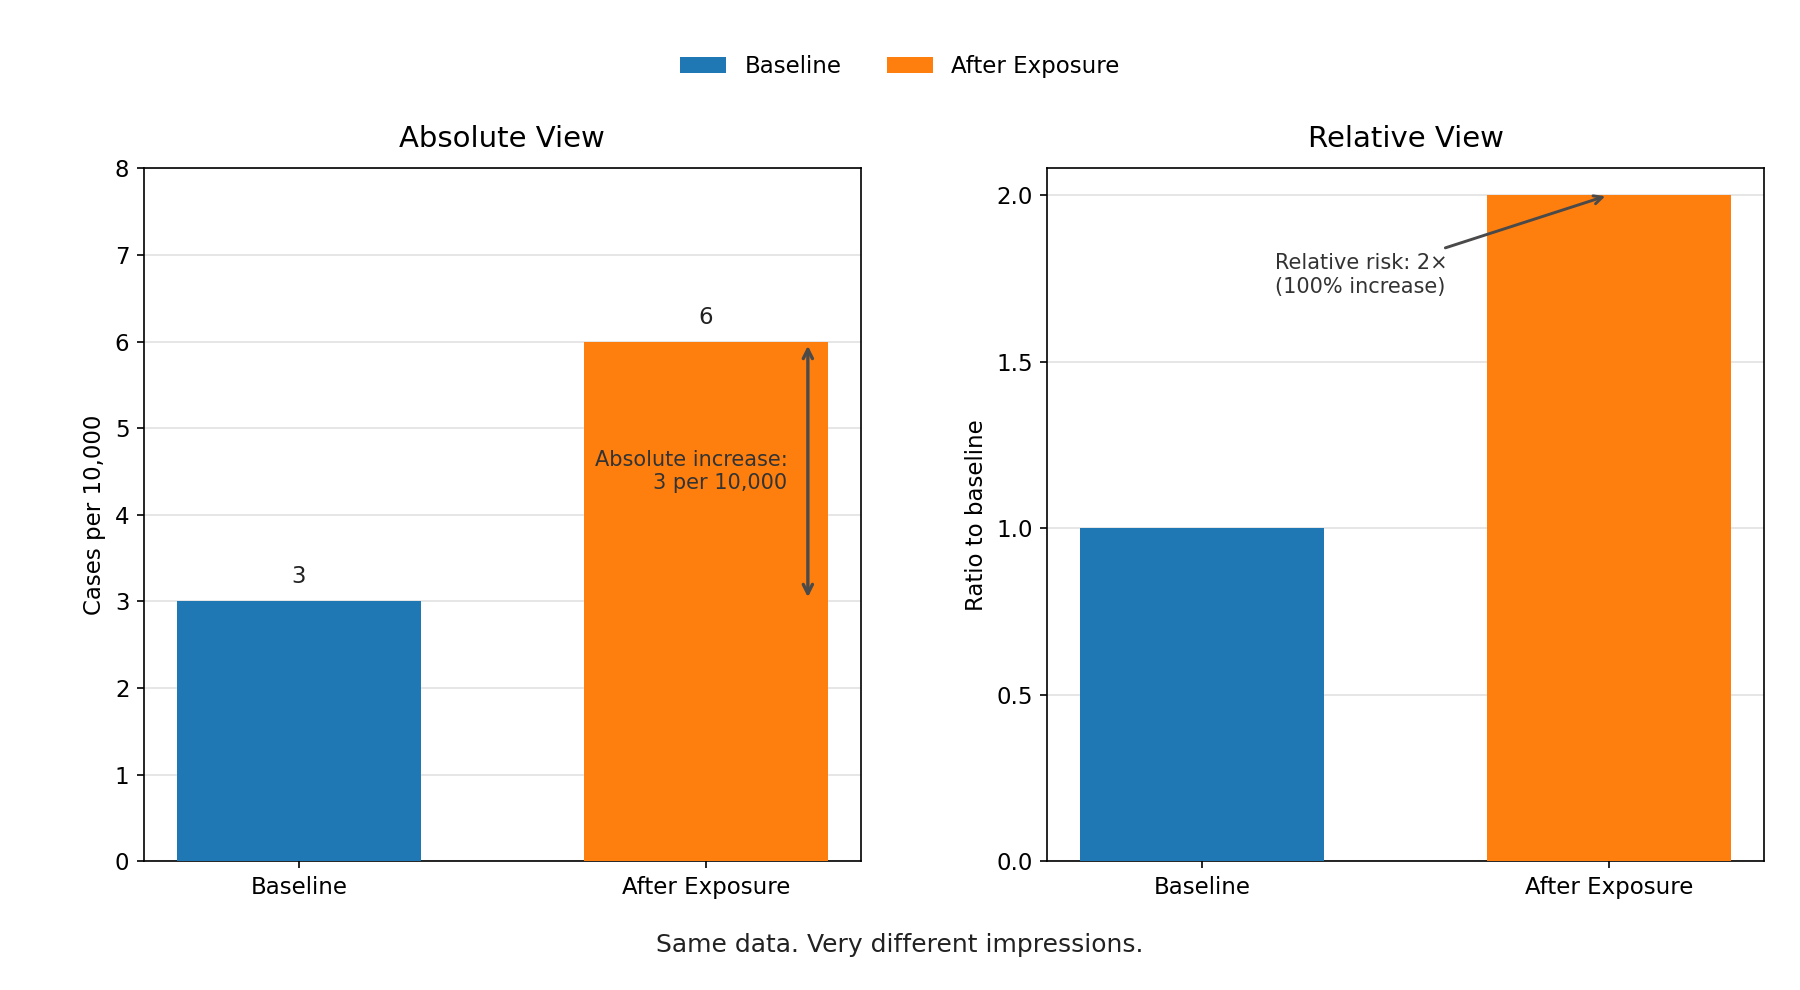
For example, if a baseline risk is 3 in 10,000 and a new exposure raises it to 6 in 10,000, the absolute risk increase is:
10,0006−10,0003=10,0003=0.0003
That is an increase of 0.03 percentage points. Notice how this immediately tells us the actual size of the change. Using the expected-count technique from the previous lesson, you can make it even more tangible: in a city of 200,000 people, this absolute increase means roughly 0.0003×200,000=60 additional cases. Absolute risk keeps us grounded in real magnitude.
new
From this ratio, you can also express the relative risk increase as a percentage:
Relative risk increase=poldpnew−pold×100%
Using our earlier numbers (pold=3/10,000 and pnew=6/10,000), let's calculate the relative risk. Because both risks are out of 10,000, we can simplify the math by just comparing the top numbers:
Relative risk=3/10,0006/10,000=36=2
A relative risk of 2 means the new risk is twice as big as the old risk.
Now, let's calculate the relative risk increase to see how headlines get their dramatic percentages:
Because the risk doubled, it is reported as a "100% increase." That sounds enormous — yet as you just calculated, the absolute change is only 3 extra cases per 10,000 people. The relative framing multiplies the feeling of danger without telling you how large the danger actually is.
This is the biggest takeaway of the lesson: if a risk starts out very small, even a massive relative increase (like doubling) still results in a tiny absolute change in the real world. Relative numbers amplify how dangerous something feels, while absolute numbers show you the actual impact.
1,0008−1,0006
1,0002=0.2%
Relative risk reduction
8/1,0008/1,000−6/1,000×100%
25%
An advertisement for this drug could truthfully say it "cuts your risk by 25%." A more complete report would say the drug "lowers the risk from 0.8% to 0.6%, an absolute reduction of 0.2 percentage points." Both statements are correct, but they leave very different impressions. Whenever you see a single percentage in a headline, ask yourself: Is this the absolute change or the relative change?
The gap between these two framings is not just an academic curiosity — it shapes real choices every day. Studies in health communication have shown that people are more likely to accept a medical treatment when its benefit is presented in relative terms than when the same benefit is shown in absolute terms. Advertisers and headline writers know this, which is why relative risk appears far more often in attention-grabbing claims.
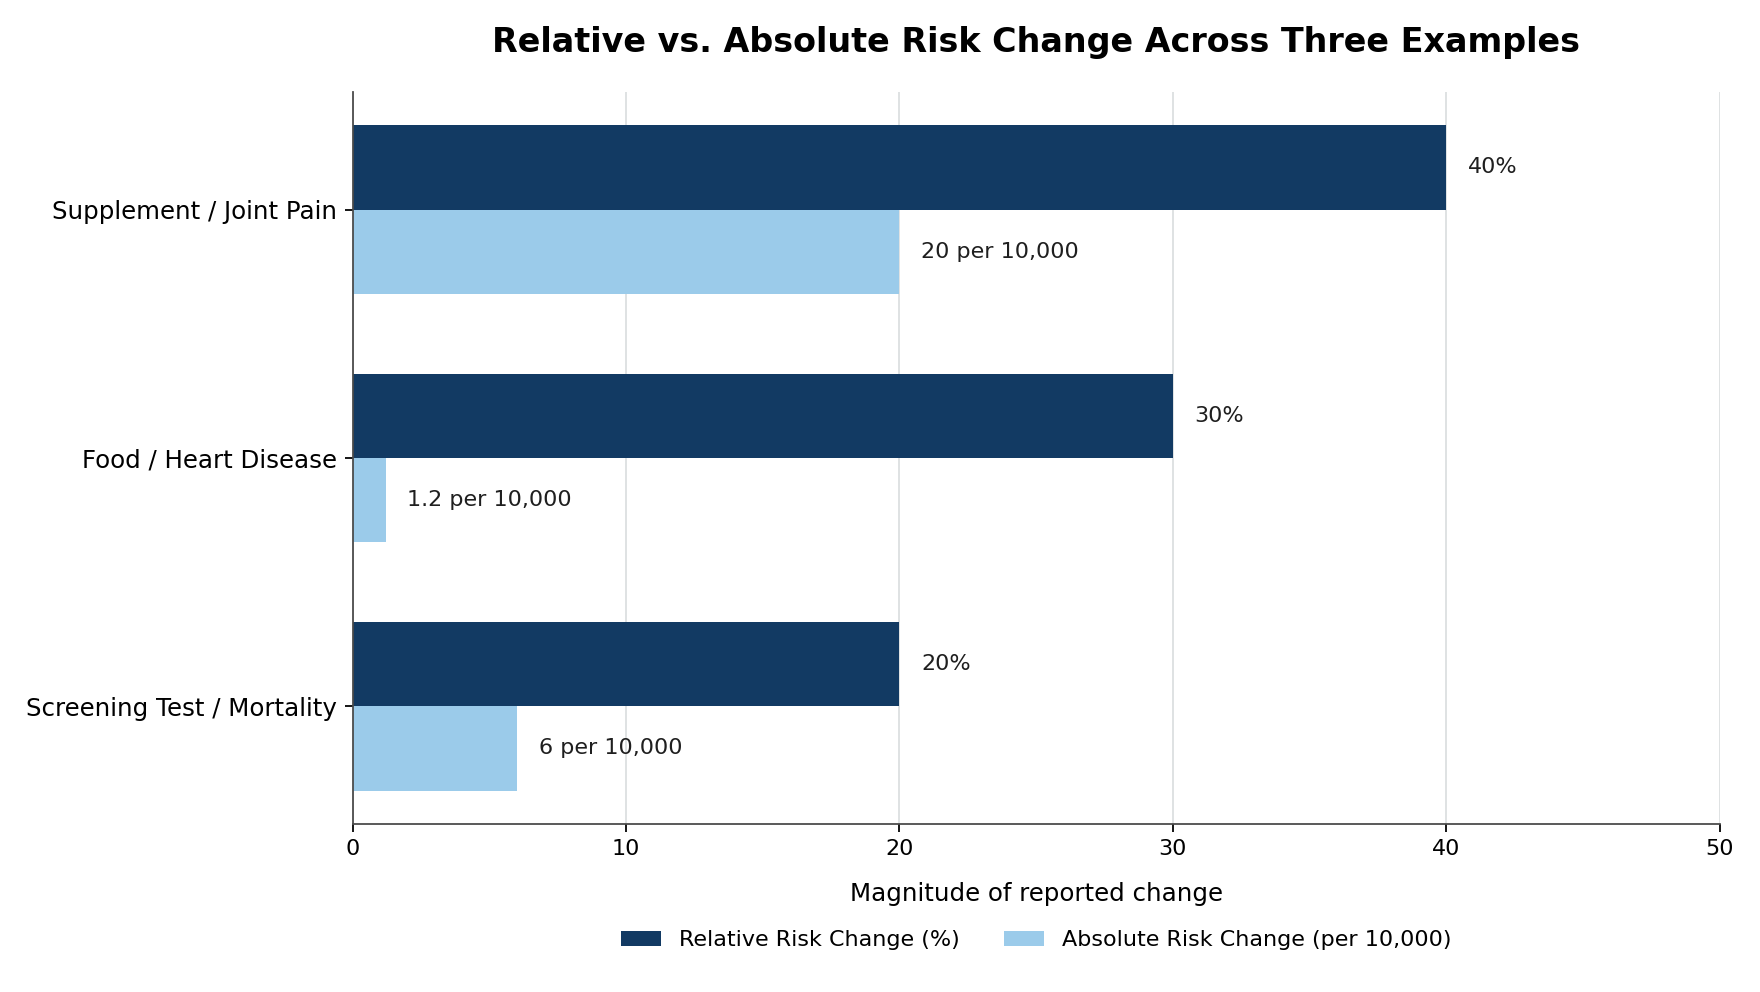
Here are a few realistic scenarios where the gap is stark:
A supplement label claims it "reduces your risk of joint pain by 40%." If the baseline risk is 5 in 1,000, the absolute reduction is only 2 in 1,000.
A news report warns that a food "increases heart disease risk by 30%." If the baseline risk is 4 in 10,000, the absolute increase is just 1.2 in 10,000.
A screening test is said to "cut mortality by 20%." If the baseline mortality is 3 in 1,000, the absolute reduction is 0.6 in 1,000.
In every case, the relative number sounds like a game-changer, while the absolute number reveals a much more modest shift. Neither framing is wrong, but only one tells us the practical size of the change. Recognizing this pattern is the first step toward evaluating any risk claim with clear eyes.
The treatment moves our risk from 6 in 1,000 down to 4 in 1,000. That is a real benefit, but knowing the absolute numbers lets us weigh it against costs, side effects, or inconvenience in a clear-headed way — something a bare "33.33% reduction" headline cannot do.