Welcome to Think Clearly About Risk in Real Life! Having built a solid foundation in reading probabilities, comparing them across formats, and understanding how outcomes can differ in the short run versus the long run, you are now ready to apply those skills to the risk claims you encounter in everyday life. By the end, you will be able to:
Turn tiny probabilities into concrete expected counts so that values like "1 in 50,000" become easier to picture and reason about.
Interpret small risks across different contexts by scaling them to larger populations and comparing them to familiar benchmarks.
Interpret expected counts smaller than 1 by translating them into everyday language like "about once every 25 years."
🤏 Why Small Probabilities Feel So Hard to Grasp
Our brains are remarkably good at comparing things we can see and touch, but very small numbers fall outside everyday experience. When someone says "1 in 50,000," we know it means rare, but we can't easily tell whether that's a little rare or extraordinarily rare. Is it closer to being struck by lightning or to catching a common cold? Without extra work, most small probabilities land in a single mental bucket labeled "probably won't happen to me."
This vagueness can lead to trouble in both directions. We might shrug off a risk that actually deserves attention, or we might panic over one that is vanishingly small. The key is to have a reliable way to translate small probabilities into something our intuition can grab onto. That is exactly what the techniques in this lesson are designed to do.
🧮 Converting a Small Probability to an Expected Count
The single most useful move when facing a small probability is to ask: How many people would this affect in a group I can picture? You can do this by multiplying the probability by a population size.
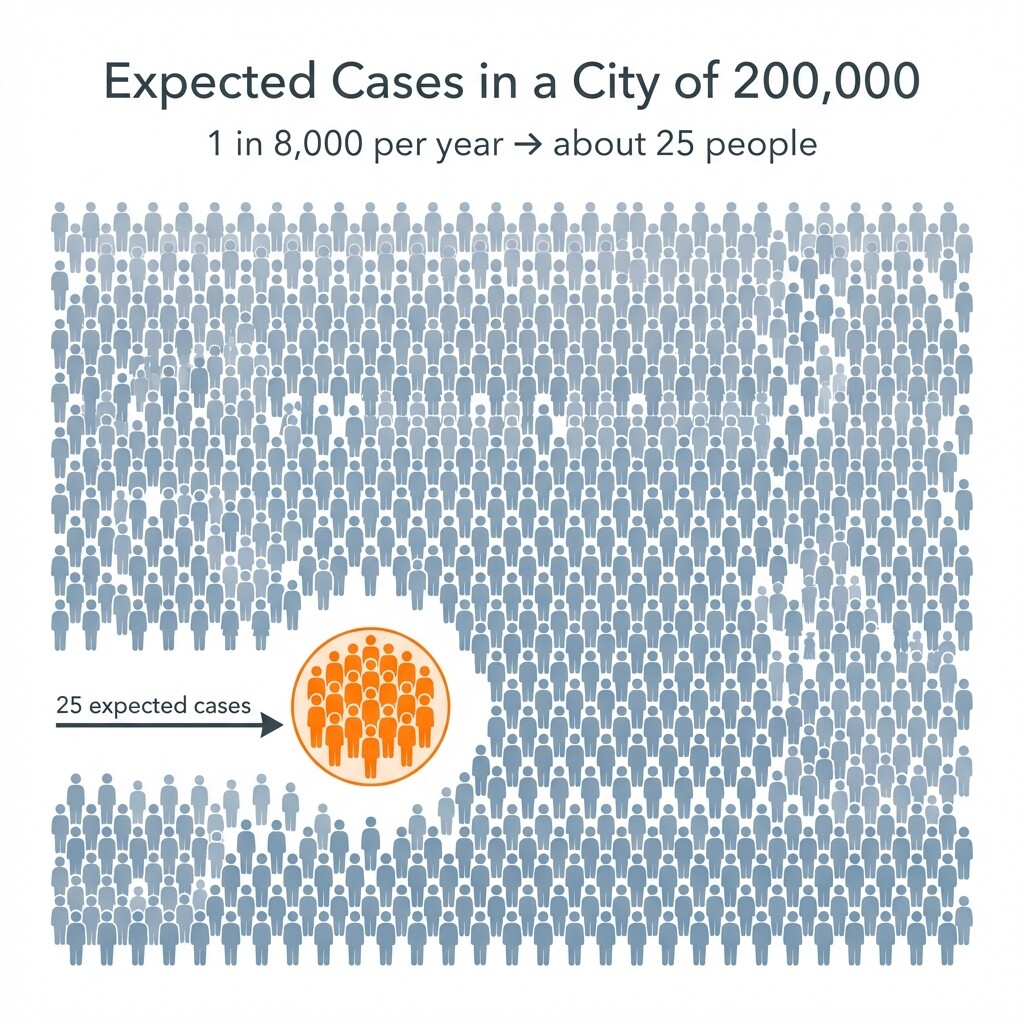
Suppose a safety report says a certain type of injury occurs with a risk of 1 in 8,000 per year. On its own, that's hard to feel. But if you think about a mid-sized city of 200,000 people, you can calculate:
Expected cases=8,0001×200,000
📊 Scaling Across Different Populations
One powerful feature of expected counts is that you can scale the same risk to any group size. This lets us see the same probability from different angles and avoid snap judgments based on a single perspective.
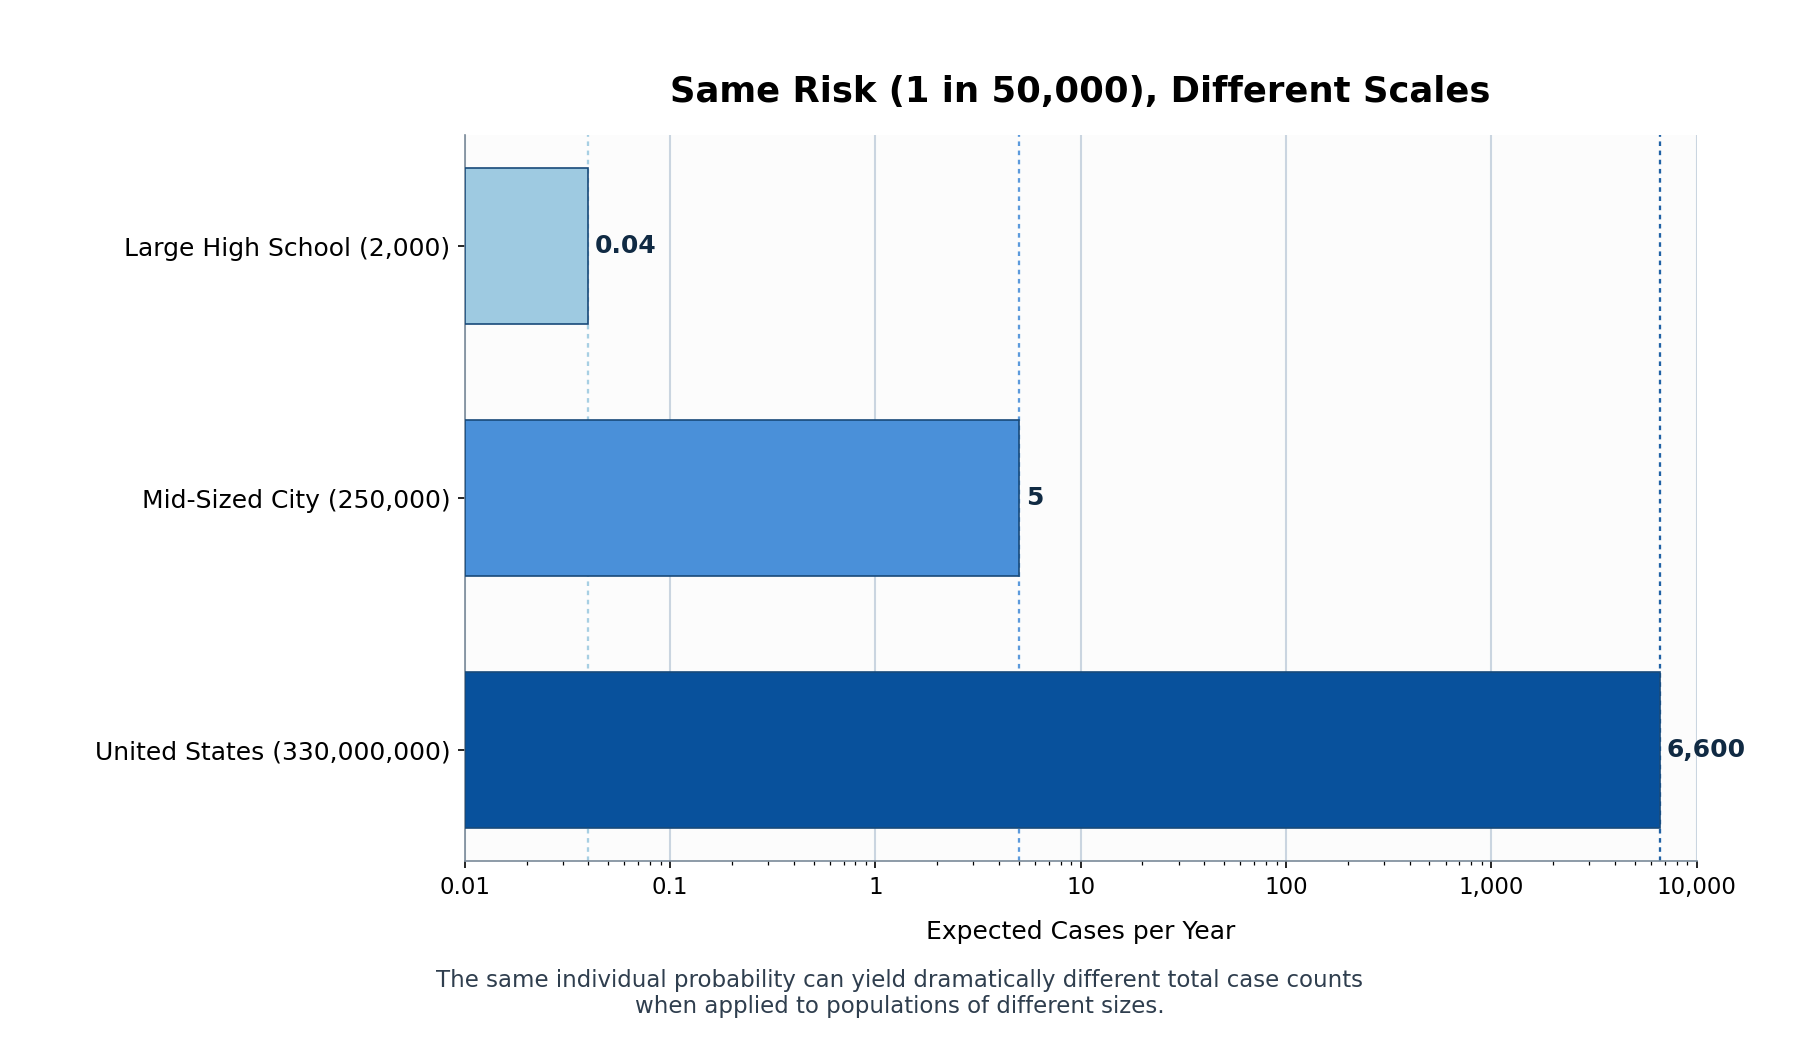
Take a "1 in 50,000" annual risk. Here is what it looks like at three familiar scales:
Population
Size
Expected cases per year
A large high school
2,000
50,0001×2,000=
🗓️ What an Expected Count Smaller Than 1 Really Means
One place people often get stuck is when the expected count comes out to less than 1. In the table above, a large high school with 2,000 students facing a 1 in 50,000 annual risk has:
Expected cases per year=50,0001×2,000=
Conclusion and Next Steps
In this lesson, you built four practical strategies for making sense of very small probabilities: converting them to expected counts with p×N, scaling those counts across different population sizes, comparing unfamiliar risks to well-known benchmarks, and translating expected counts below 1 into more intuitive statements like "about one case every 25 years."
Up next, you will put these strategies to work in a series of hands-on exercises. You'll calculate expected cases in real populations, scale risks from a city to a national level, interpret expected counts smaller than 1, and write your own grounded interpretation of a consumer safety claim.
Be a part of our community of 1M+ users who develop and demonstrate their skills on CodeSignal
=
25
Now the number has a face: roughly 25 people in that city each year. That's enough to fill a classroom. Suddenly the risk isn't just an abstract fraction; it's a concrete image you can reason about.
The general formula is straightforward:
Expected count=p×N
where p is the probability (as a decimal or fraction) and N is the size of the group. This works for any combination of probability and population, and it's the foundation for everything else in this lesson.
0.04
A mid-sized city
250,000
50,0001×250,000=5
The United States
330,000,000
50,0001×330,000,000=6,600
At the school level, you'd usually see no cases in a given year. In a city, you'd expect about 5 per year. Nationally, the same ‘tiny’ risk corresponds to about 6,600 expected cases per year. This is a critical insight: a risk that sounds negligible for one person can still generate large numbers when spread across millions. Keeping both perspectives in mind helps us avoid the trap of dismissing a risk entirely or overstating it for an individual.
Expected counts become even more meaningful when you compare one risk to another that you already understand. If you know that the annual risk of a certain injury is about 1 in 8,000, and the annual risk of being in a reportable car accident is roughly 1 in 100, you can immediately see that driving is far more dangerous for most people. Comparisons like this anchor an unfamiliar risk to a familiar one, turning a mysterious number into something you can feel.
A few practical tips for making fair comparisons:
Match the time frame. Compare annual risks to annual risks, not an annual risk to a lifetime risk.
Match the unit. Compare per-person risks to per-person risks, not per-trip to per-year.
Choose a well-known benchmark. Risks people encounter regularly, like driving or common household injuries, make good reference points.
When we say "this risk is about 80 times smaller than the risk of a car accident," most people instantly get a usable sense of scale. That is the power of comparison.
0.04
But what does 0.04 cases per year actually mean?
It does not mean "4% of a case" in any literal sense. It means that in most individual years, the school would have 0 cases, but over many years, the average would work out to 0.04 cases per year.
A useful way to make this more intuitive is to turn the rate into an average waiting time:
Average time between cases≈expected cases per year1
So for the high school:
0.041=25
That means about 1 case every 25 years, on average.
Here are a few examples of this translation:
Expected cases per year
More intuitive interpretation
0.04
About 1 case every 25 years
0.5
About 1 case every 2 years
2
About 2 cases per year, or 1 every 6 months
5
About 5 cases per year, or 1 every 2 to 3 months
This is especially helpful because many small risks produce expected counts below 1 for groups like schools, workplaces, or neighborhoods. Saying "0.04 cases per year" feels abstract. Saying "about one case every 25 years" is much easier to picture.
One important caution: this is an average, not a schedule. A school could go 40 years with no case at all, or see 2 cases unusually close together. The point is not to predict the exact timing. The point is to give your intuition a clearer sense of how rare the event really is.
When you see a small expected count, a good question to ask is:
"How often would that be in practice — once a year, once a decade, or once in a generation?"
That question often turns a vague number into something you can reason about.