Previously, we learned to calculate relative frequency — the proportion of trials in which an event occurred — and use it as a practical estimate of probability. Now we turn to the natural follow-up question: how much should we actually trust that estimate?
As it turns out, the answer depends heavily on one thing: the number of trials. In this lesson, we will see why an estimate based on a small number of trials can be surprisingly unreliable, and what that means for how we interpret data.
Recall from Lesson 1 that relative frequency is calculated as:
where is the number of times the event occurred and is the total number of trials. This ratio is our best experimental estimate of the true probability of the event. The key word is — there is no guarantee it will match the true probability exactly, and the size of turns out to matter a great deal.
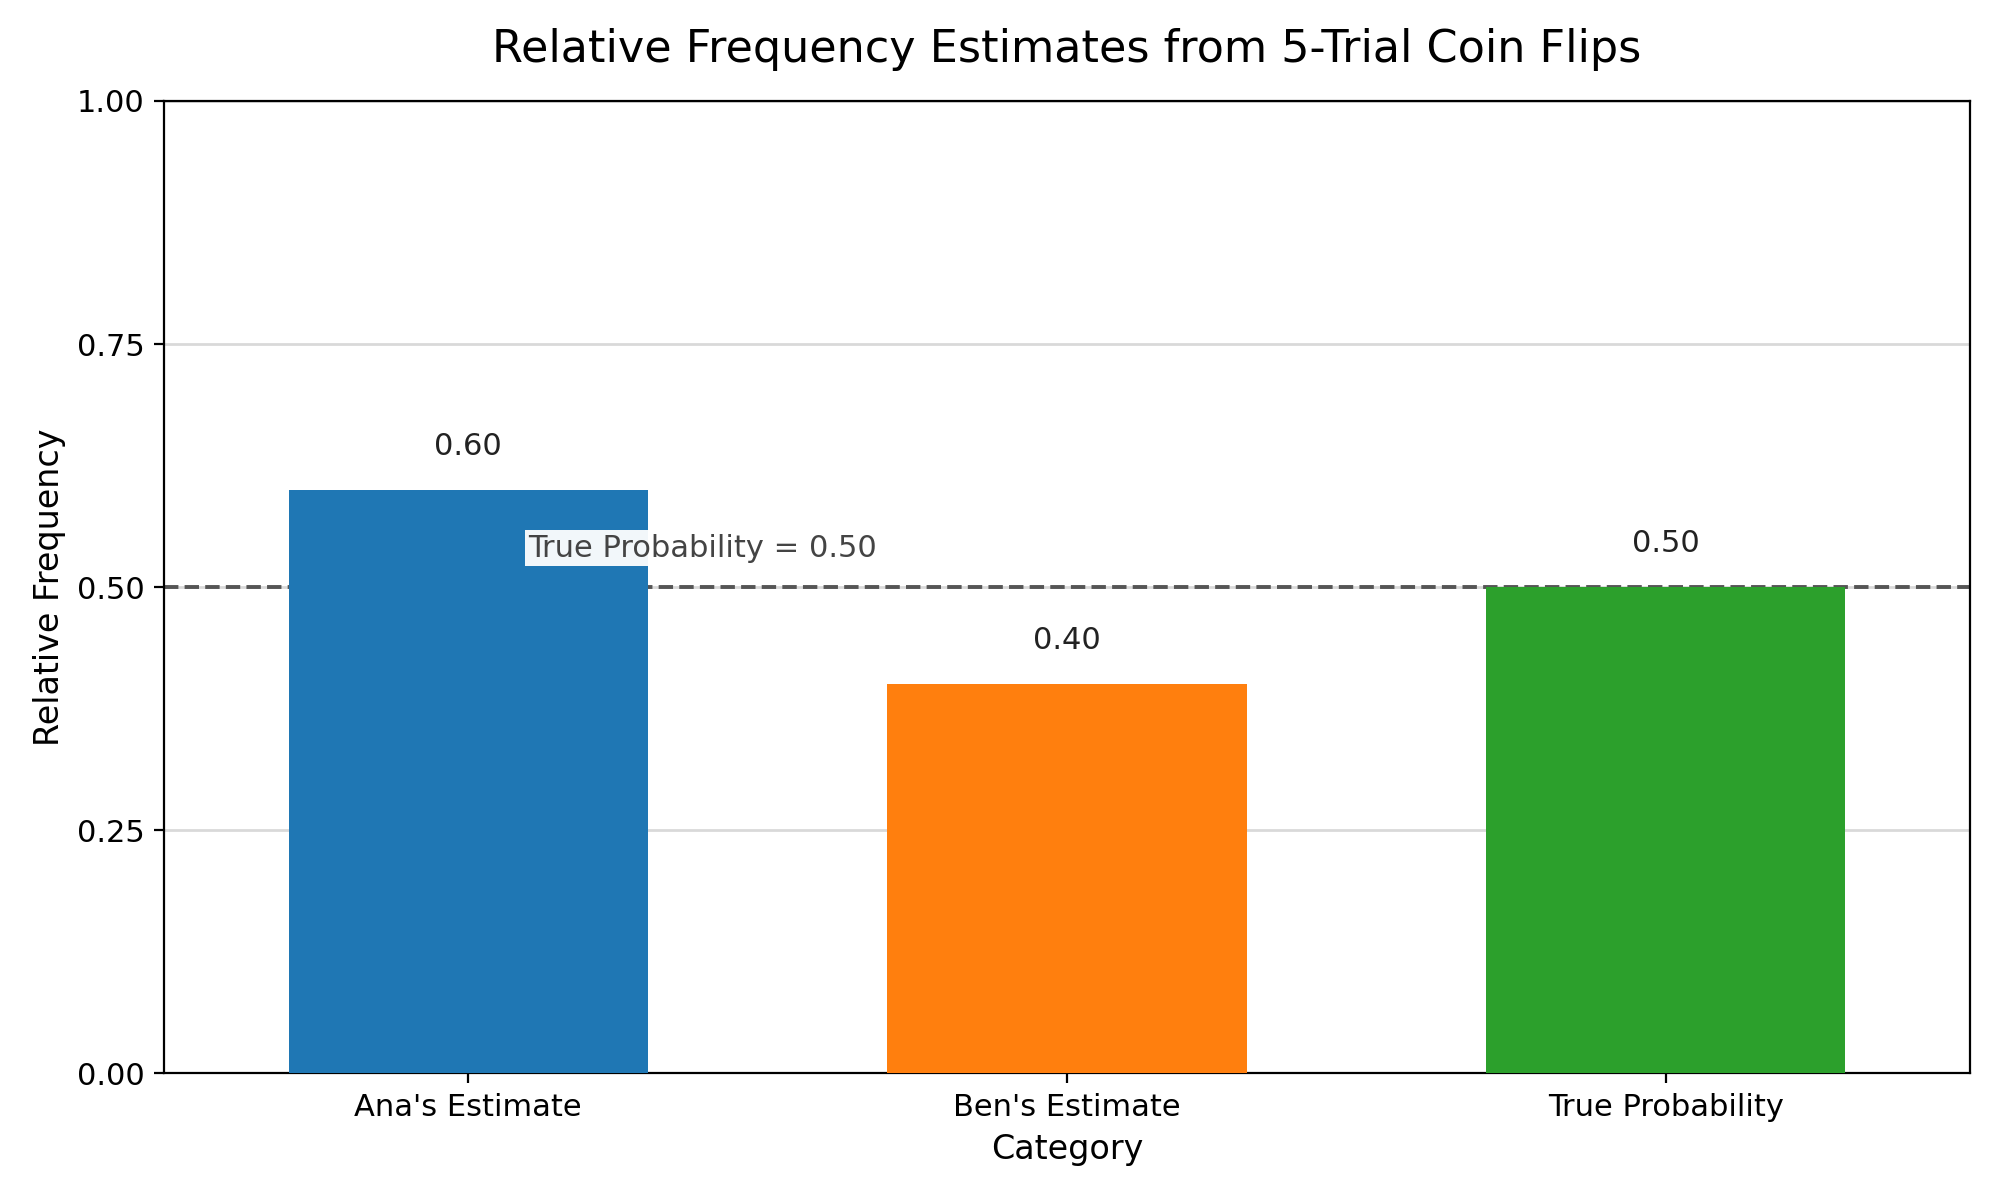
Suppose two classmates, Ana and Ben, each flip the same fair coin 5 times and record the number of heads.
The reason small samples are so unstable comes down to the size of in the denominator. When is small, each individual trial makes up a large fraction of the total, so any single outcome has a noticeable effect on the relative frequency.
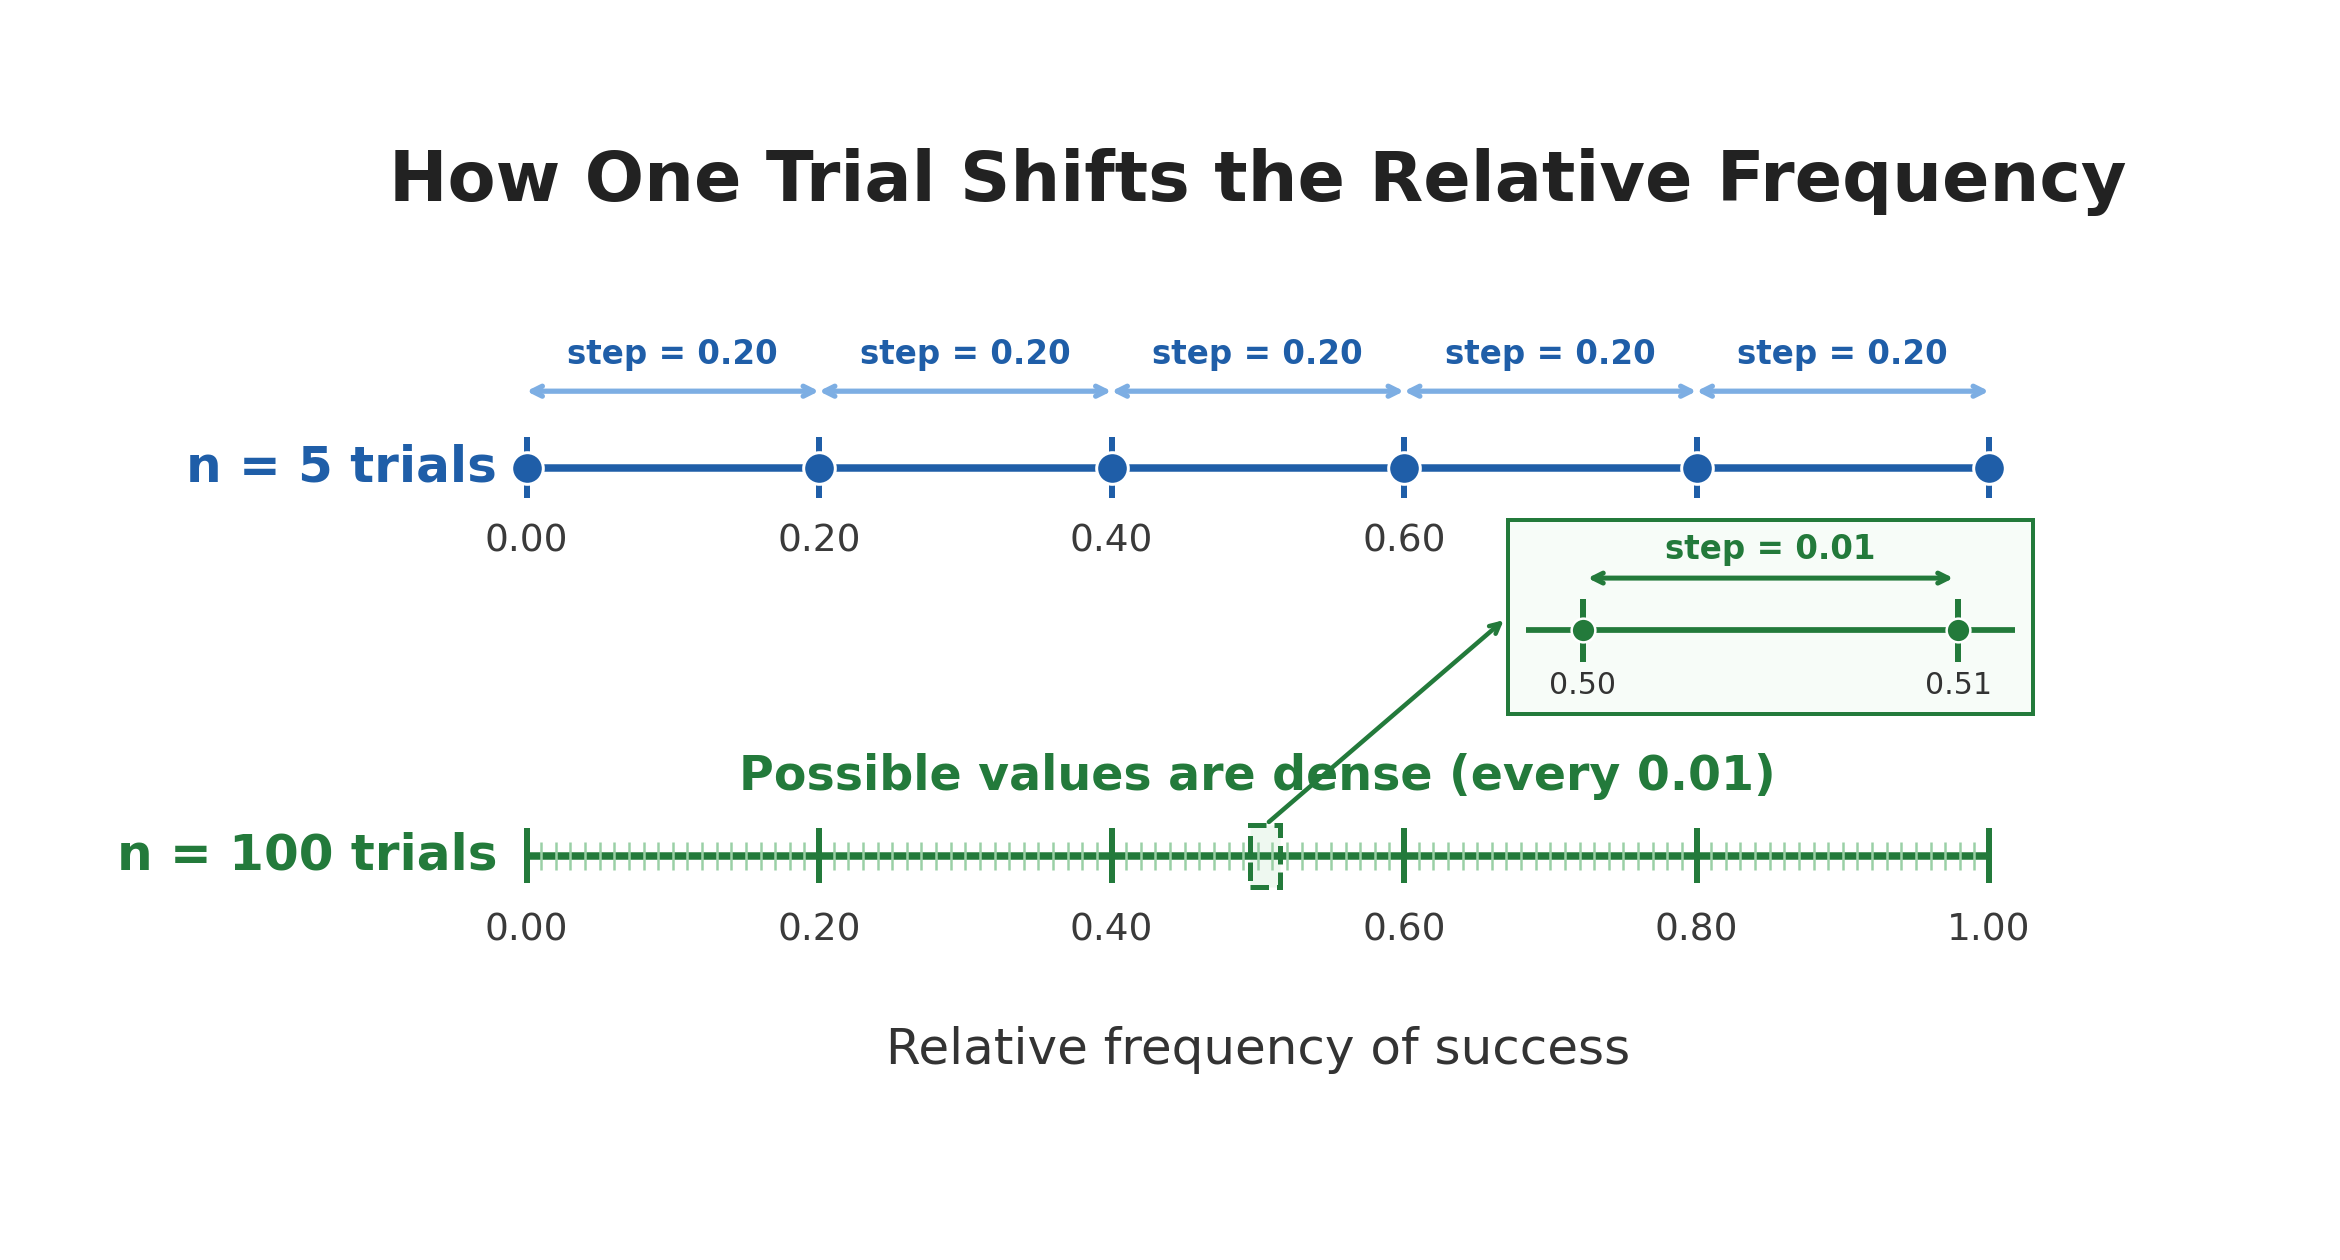
With only 5 trials, one additional occurrence of the event changes the estimate by:
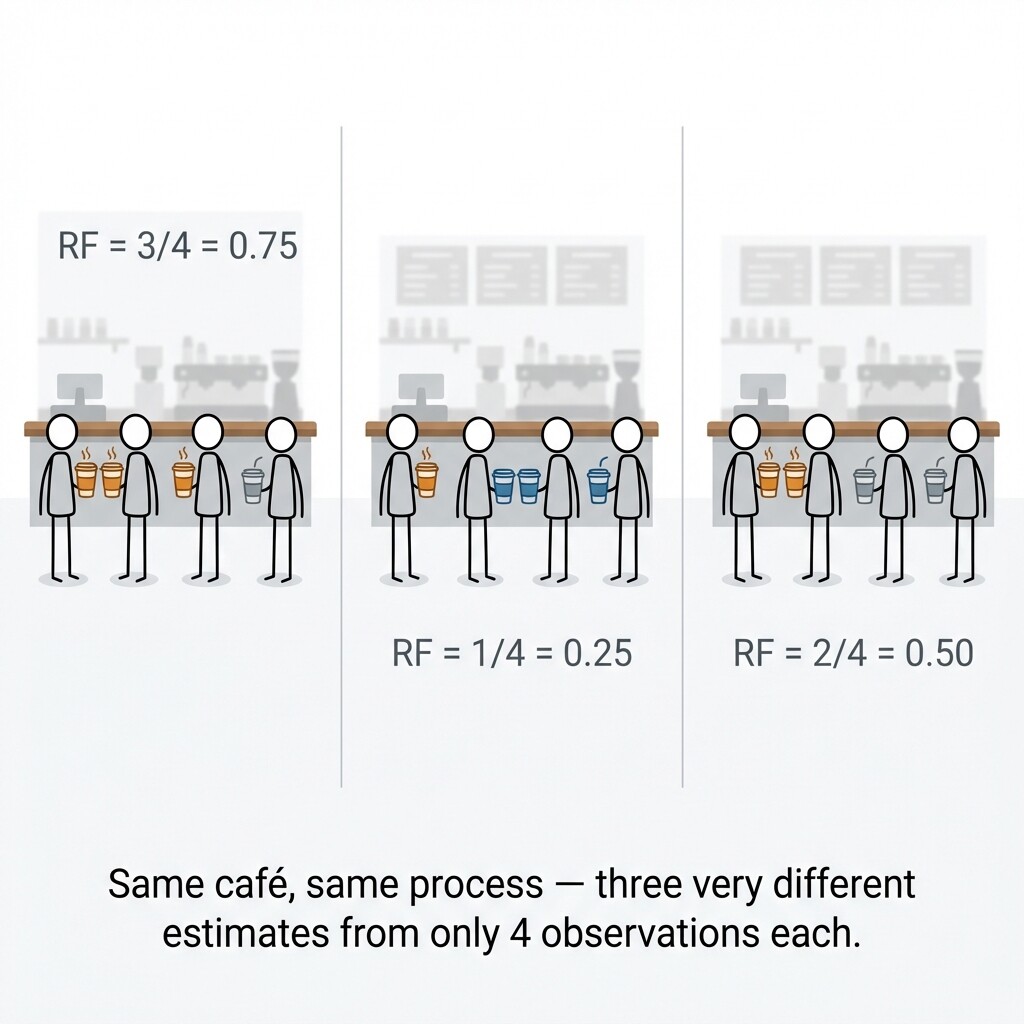
This sensitivity to individual outcomes makes small-sample estimates especially risky to act on. Suppose we observe 4 customers enter a coffee shop, and 3 of them order a latte. The relative frequency of latte orders is:
It is tempting to conclude that 75% of all customers order lattes. But this estimate rests on just 4 observations, and the next group of 4 customers might paint a very different picture. With so few trials, the estimate can swing widely from one data set to the next, drifting far from the true proportion simply by chance.
The core issue is that with few trials, there is not enough data to smooth out the natural random variation in any chance process. A high or low relative frequency might reflect a genuine pattern — or it might just be a lucky streak. With a small sample, we simply cannot tell the difference.
In this lesson, we saw that relative frequency can vary substantially from one small data set to another, making it an unreliable estimate of the true probability when the number of trials is low. The root cause is mathematical: with few trials, each individual observation carries a large share of the total, leaving the estimate exposed to the random ups and downs of chance.
The practice exercises ahead will let you explore this firsthand. You will compute relative frequencies from small data sets, compare results across different samples, and practice explaining why those results differ. Keep the key idea close as you work: a small sample is not wrong — it is simply not enough, and recognizing that distinction is an important step in thinking clearly about probability.