Welcome back to Percentages in News and Statistics! This is lesson five of six, so we are nearly at the finish line. In earlier lessons, we learned how to calculate percent changes, identify the group behind a reported percentage, estimate real counts from those percentages, and compare percentages across groups of different sizes. Now we tackle one of the most common sources of confusion in news and data reporting: the difference between a change measured in percentage points and a relative percent change. These two phrases sound almost identical, but they describe very different things. Mastering this distinction will sharpen the way we read headlines, polls, and statistical claims.
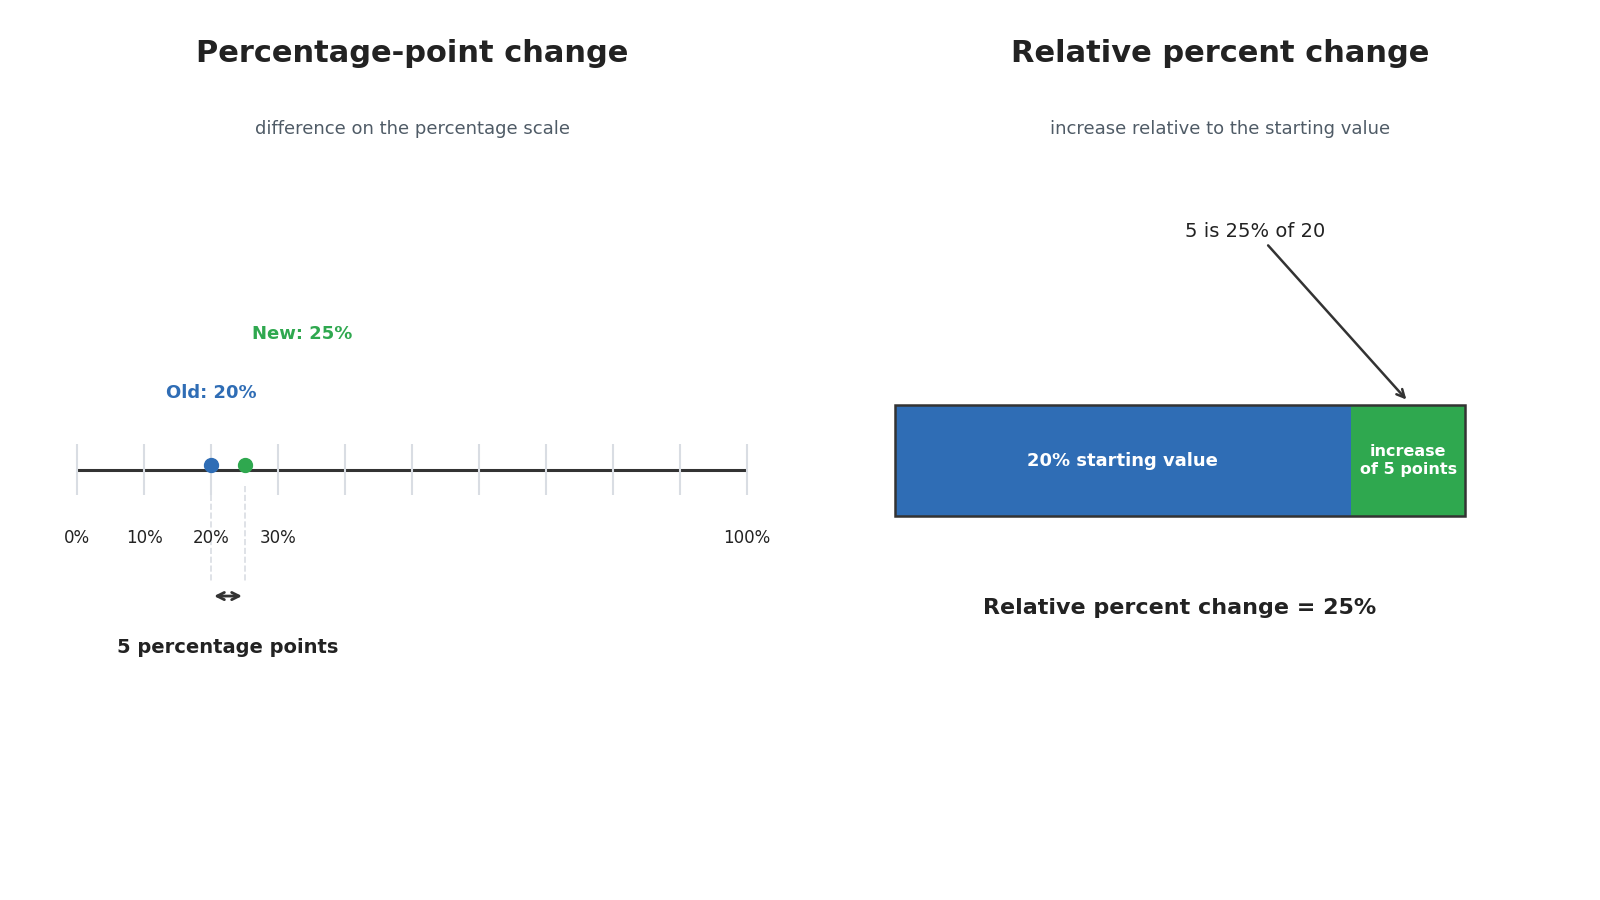
Consider a simple scenario: a city's recycling rate moves from 20% to 25%. How should we describe that change? One natural answer is "it went up by 5." Another perfectly valid answer is "it went up by 25%." Both statements can be correct, yet they measure different things.
The first description focuses on the gap between the two percentages — a straightforward subtraction. The second describes how large that gap is compared to where we started — a proportional comparison. This entire lesson is about learning to tell these two descriptions apart and recognizing which one a news report is actually using.
When we subtract one percentage from another, the result is measured in percentage points (often abbreviated pp). It is the straightforward arithmetic difference between two percentage values:
In our recycling example, the rate went from 20% to 25%, so the change is percentage points. Notice that we say not The phrasing "percentage points" signals that we are simply measuring the distance between two percentages on the 0-to-100 scale, with no further calculation involved.
As we covered in the first lesson of this course, percent change tells us how large a change is relative to the starting value. The formula works the same way even when the values being compared are themselves percentages:
Now that we have both tools in hand, let's line up a few scenarios to see how the two measures can tell surprisingly different stories:
Notice the pattern. When the starting percentage is small, even a modest percentage-point change translates into a large relative percent change. Unemployment rising by just 2 percentage points (from 4% to 6%) is a 50% relative increase. On the other hand, when the starting percentage is already large, a bigger percentage-point jump can correspond to a smaller relative change. Voter turnout rising by 6 percentage points (from 60% to 66%) is only a 10% relative increase.
This is why the choice of measure matters so much in reporting. The same underlying shift can sound modest or dramatic depending on which number a headline chooses to feature.
Headlines and reports frequently use loose phrasing that blurs the line between these two measures. Here are some language cues to watch for:
- "rose 3 percentage points" → absolute difference (e.g., from 12% to 15%)
- "rose 3 percent" or "increased by 3%" → typically a relative change (3% of the starting value)
- "went from X% to Y%" → states both values but does not specify which type of change is intended
Let's apply these cues to a realistic headline: "The approval rating rose by 5%, from 40% to 45%." Is this wording accurate? The arithmetic difference is percentage points, but the relative change is . So the headline should say not Calling it a "5% rise" is technically incorrect and understates how the change relates to the original value.
Mixing up these two measures can make a change sound much larger or smaller than it truly is. Suppose a news report says "Infection rates fell by 50%." That sounds dramatic. But if the rate dropped from 2% to 1%, the percentage-point change is just 1. Describing the same shift as "a 1-percentage-point decrease" paints a much calmer picture, even though both descriptions are mathematically valid.
The reverse can happen too. A politician might say "support grew by only 2 percentage points," which sounds modest. But if support moved from 4% to 6%, that is a 50% relative increase — a number that sounds far more significant. As careful readers, our job is to notice which measure is being used and, when possible, calculate the other one ourselves to get the full story.
The core takeaway from this lesson is that percentage points measure the simple arithmetic gap between two percentages, while relative percent change measures how large that gap is compared to the starting value. Because the same data shift can produce two very different numbers, news reports can frame a change as dramatic or minor depending on which measure they choose. Learning to identify and calculate both gives us a much more complete picture of what the statistics are really saying.
Now it's time to put these skills into practice! In the upcoming exercises, you'll match phrases to their correct meanings, identify which measure a headline is reporting, fill in both versions of the same change, and write your own interpretation of a real-style media claim. Let's see how confidently we can decode the language behind the numbers!