Welcome back to Percentages in News and Statistics! This is the sixth and final lesson of the course, and it brings together everything we have built so far. Over the previous five lessons, we learned how to calculate percent changes, read percentage shares, estimate real counts, compare percentages across groups of different sizes, and distinguish percentage points from relative percent change. Now we turn our attention to a problem that shows up constantly in advertising, headlines, and everyday conversation: percent claims that leave out the base. A percentage without its base is like a fraction without a denominator — it looks precise but tells us surprisingly little. By the end of this lesson, you will be able to spot these incomplete claims and explain exactly what information is needed to evaluate them.
As we explored earlier in this course, every percentage describes a share of some specific group or quantity. That group or quantity is the base. When someone says "60% of registered voters support the policy," the base is clear: registered voters. We know exactly what 60% refers to, and we could estimate a count if we knew how many registered voters there are.
But what happens when someone simply says "60% support the policy"? Now we are left guessing. Is that 60% of all adults? Of people who were surveyed? Of people in one particular city? The number sounds solid, yet without its base it could mean very different things.
This lesson is all about building the habit of pausing and asking one powerful question: percent of what? That single question is your best defense against misleading statistics.
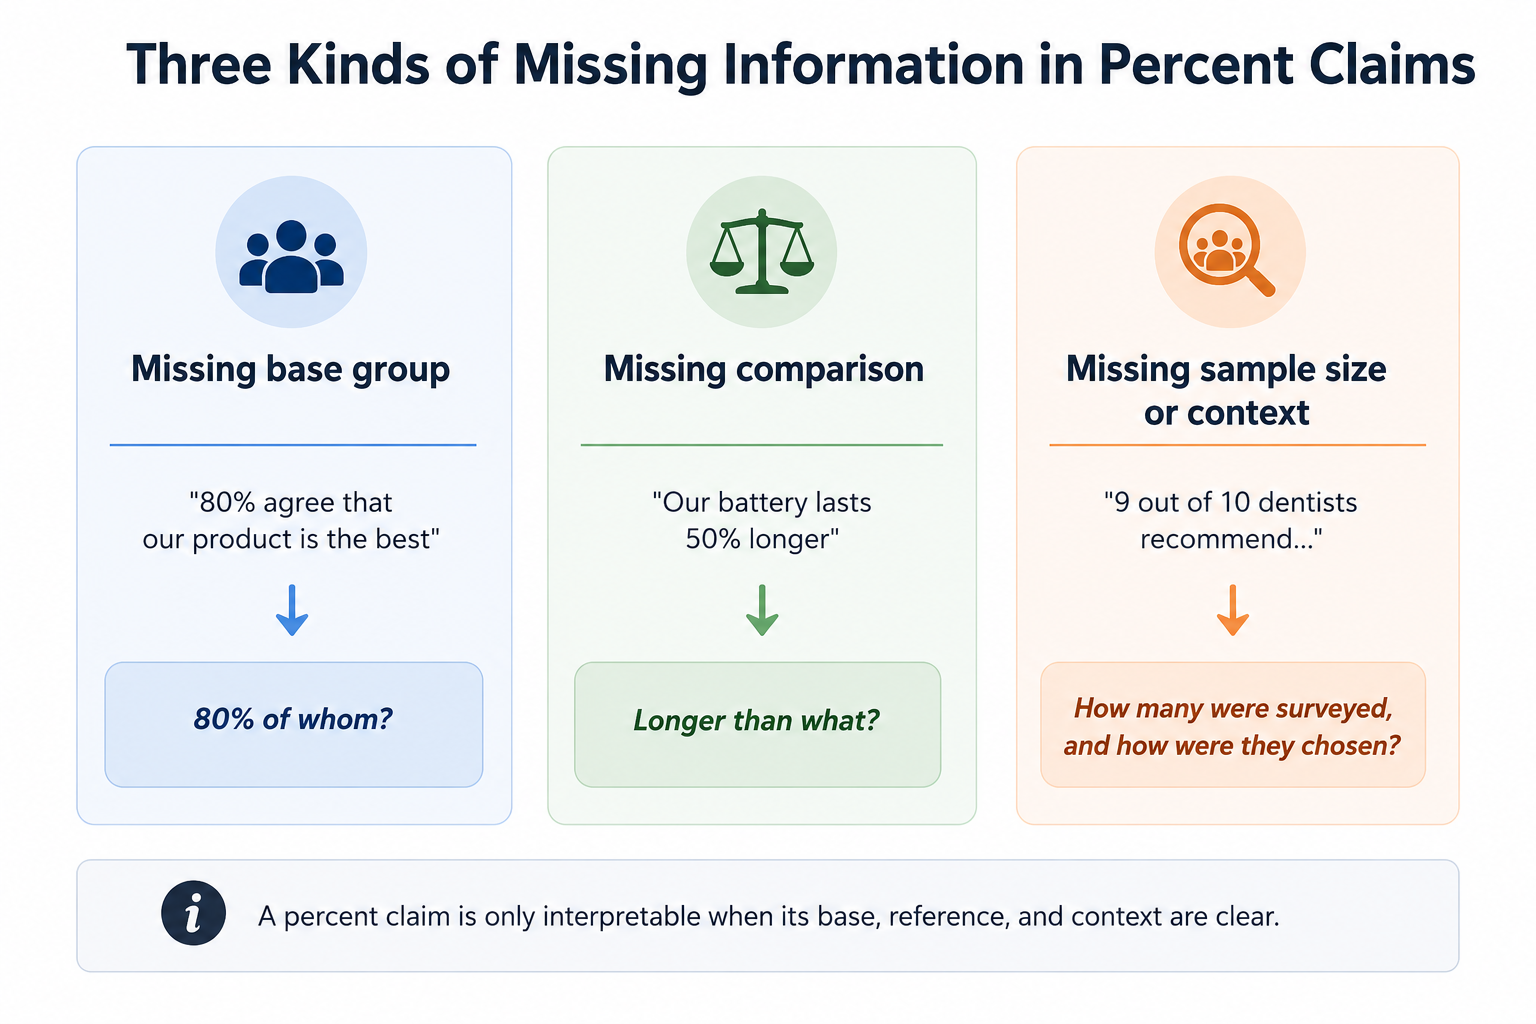
Not every incomplete claim is missing the same thing. In practice, vague percent statements tend to fall into three categories:
-
Missing base group — The claim does not say who or what was measured. For example, "80% agree that our product is the best" does not tell us whether that 80% comes from a random sample of shoppers, the company's own customers, or the company's employees.
-
Missing comparison — The claim states a change or advantage without naming what it is measured against. For example, "Our battery lasts 50% longer" invites the question: longer than what? A competitor's battery? The brand's previous model? An industry average?
-
Missing sample size or context — The claim may hint at a group but gives no sense of how large or representative it is. The classic "9 out of 10 dentists recommend…" sounds impressive until we ask: how many dentists were surveyed, and how were they selected?
The summary below shows these three kinds of missing information and the question each one should trigger.
Recognizing which piece is absent is the first step toward deciding whether a claim deserves our trust.
Let's walk through a few realistic claims and practice identifying what is absent.
Claim 1: "Sales increased by 200%."
This sounds dramatic, but we need two things to evaluate it. First, what is the starting value? A 200% increase from $100 in sales means the new figure is:
A 200% increase from $1,000,000, on the other hand, means the new figure is $3,000,000. The same percentage tells a very different story depending on the original amount. Second, over what time period did this increase occur? A 200% rise over ten years feels quite different from a 200% rise in a single month.
Claim 2: "75% of participants saw improvement."
Here the word participants hints at a group, but key details are missing. How many participants were there? If the study had only 4 people, then 75% means just 3 individuals — hardly convincing. Converting a percentage back into an estimated count, as we practiced earlier in this course, can reveal whether the numbers are truly meaningful:
Whenever you encounter a percentage in a headline, advertisement, or report, a short mental checklist can help you decide if the claim is complete:
- Base group — Does the claim name the specific group or quantity the percentage applies to?
- Comparison reference — If the claim implies a change or advantage, does it state what is being compared?
- Sample size and selection — Does the claim indicate how many observations were involved and how they were chosen?
If any of these are missing, the claim may still be true, but you simply do not have enough information to judge. A careful reader notices the gap and looks for the missing detail before drawing a conclusion. Think of this checklist as the final quality test you run on any percentage you encounter in the wild.
Throughout this course, we have seen that percentages are powerful but only as clear as the context that surrounds them. A percentage-point change can be confused with a relative change. A percentage from a small group can be mistakenly compared with one from a much larger group. And a percentage with no stated base — the focus of today's lesson — can mean almost anything the speaker wants it to mean.
The habit we are cementing here is simple: pause before accepting a percent claim, and ask what information is missing. If the base, comparison, or sample size is not provided, the percentage is incomplete — and you now have the skills to say precisely why it falls short.
In this final lesson, we learned that every percentage needs a clearly stated base to be meaningful. We identified three common types of missing information — the base group, the comparison reference, and the sample size — and practiced spotting each one in realistic claims. Combined with the percent-change, share-reading, and comparison skills from the earlier lessons, you now have a complete toolkit for reading percentages in news and statistics with genuine confidence.
Up next are the practice exercises, where you will evaluate real-style claims, match them to the exact piece of missing information, and write your own critique of an incomplete headline. Let's put that "percent of what?" instinct to work!
