Welcome back to Outsmarting Probability Traps! In the first two lessons, you built a solid toolkit for thinking about chance. Now you will face a trickier question: when you do spot a pattern in real-world data, how do you decide whether it reflects a genuine change or is just randomness doing its thing? By the end, you will be able to:
- Use a baseline to judge whether a result is actually unusual — instead of reacting to a number in isolation, you will compare it to the longer-term average or expected level.
- Recognize when short-term results are too small to be convincing — and explain why patterns based on only a few observations can swing wildly just by chance.
- Evaluate whether a pattern is strong enough to trust by asking whether it differs meaningfully from the baseline, is supported by enough data, and stays consistent over time.
The first two lessons gave us two important guardrails. On one side, we know not to be startled by every streak, because randomness is naturally clumpy. On the other side, we know not to expect a streak to reverse, because independent events do not self-correct. But life often demands a third skill: deciding whether an observed trend is meaningful enough to act on.
Imagine a small bakery notices that sales jumped over the past three days. Should the owner order extra supplies? Or imagine a teacher sees that a student failed two tests in a row after months of strong grades. Should the teacher intervene? These situations require us to evaluate the evidence before drawing conclusions, and that is exactly what this lesson is about.
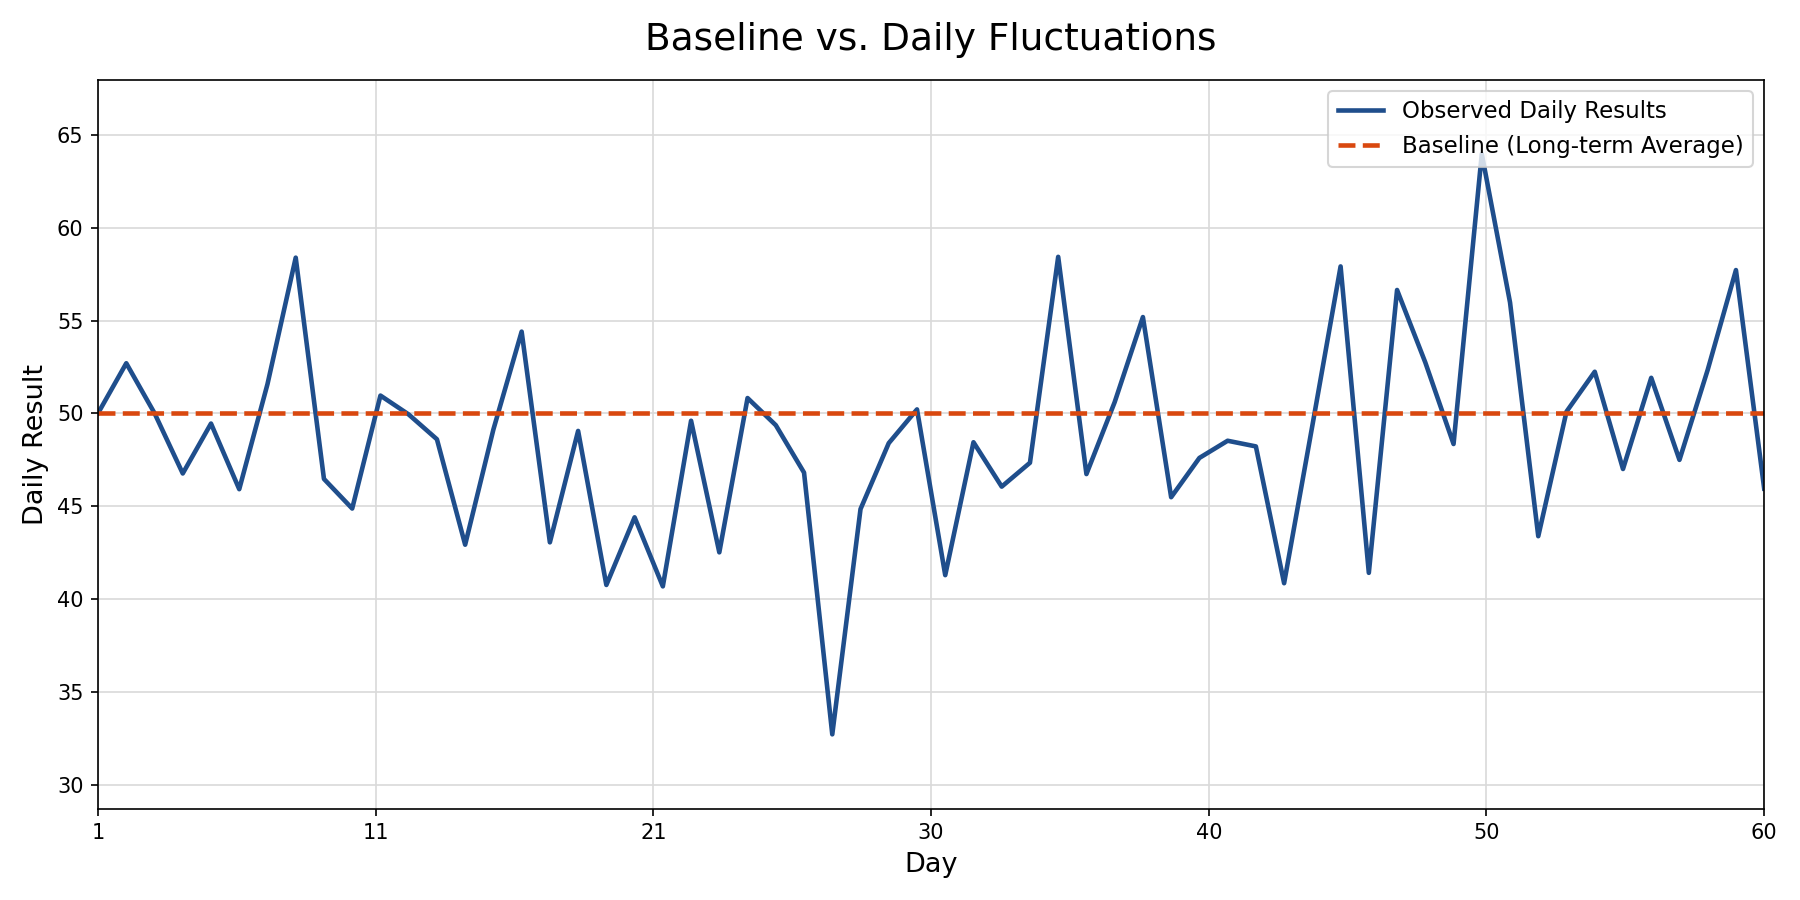
The first step in evaluating any pattern is asking: compared to what? A number on its own tells us very little. Saying "we had 12 customer complaints today" sounds alarming, but not if the daily average over the past year is 11. A pattern only stands out when we measure it against a baseline — the typical or expected result drawn from longer-term data.
Think of a baseline as an anchor. For a salesperson, it might be their close rate over the past year. For a website, it might be average daily traffic over the past six months. For weather, it might be the historical average temperature for a given month. Without a baseline, we have no way to judge whether a recent result is unusual or perfectly ordinary.
As you may recall, small samples produce a wide range of outcomes just by chance. This is one of the biggest reasons short-term patterns fool us. Let us walk through a concrete example.
Suppose a salesperson has a long-term close rate of , based on hundreds of deals over the past year. That is a reliable baseline. Now imagine that in one particular week, they close 5 out of 8 deals, for a rate of:
When you notice something that looks like a trend or a shift, a simple set of questions can help you decide whether the evidence is strong enough to trust:
- How does it compare to the baseline? If the observed result is close to the long-term average, there may be nothing unusual happening. The bigger the gap between the observation and the baseline, the more attention it deserves.
- How much data is behind it? A pattern based on two days, five coin flips, or one week of sales is built on very little information. The more data points supporting the pattern, the more confident you can be that it is not just noise.
- Has it been consistent over time? A single spike or dip is easy for randomness to produce. If the pattern holds steady across multiple time periods or repeated observations, it is far more likely to reflect a real change.
Think of these three questions as a quick checklist. A pattern that passes all three is much more likely to be real than one that only passes one.
Let us apply our checklist to a realistic scenario. A small bakery sells an average of loaves per day, based on the past year of data. Over the last three days, sales have jumped to around loaves per day. The owner is wondering whether to order significantly more supplies going forward.
Step 1 — Compare to the baseline. The recent average is loaves per day, while the yearly baseline is loaves per day. To find the size of the jump, we first subtract the baseline from the recent value:
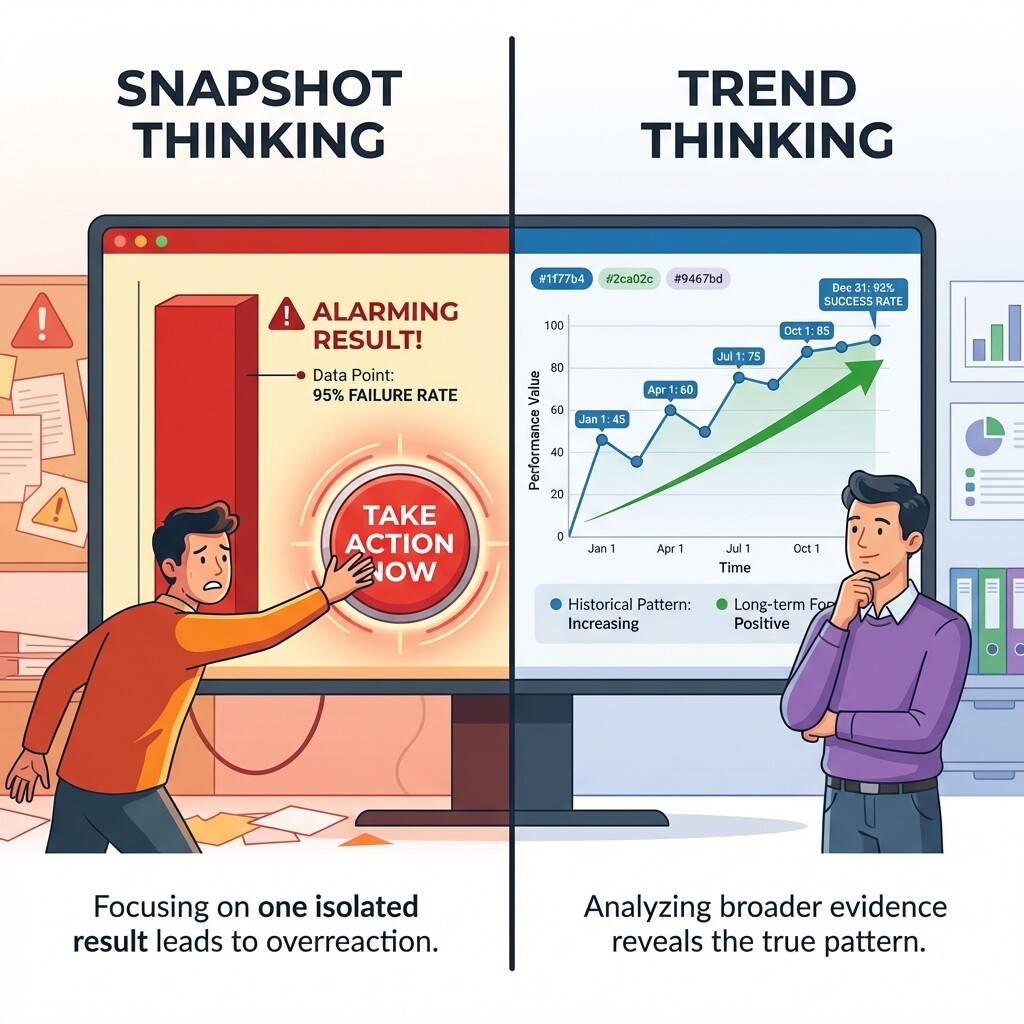
Our brains are wired to spot patterns and react quickly. In many areas of life, this instinct serves us well. But when it comes to evaluating data, acting too fast on too little evidence leads to poor decisions. The three-question checklist from the previous section is your deliberate counterweight to that impulse. The most common mistake is skipping straight from noticing a result to explaining it:
- We build a narrative first ("the new marketing campaign is working!" or "the team is falling apart").
- Then we latch onto whatever short-term numbers seem to confirm it, without ever checking them against the baseline or asking whether the sample is large enough.
Always run the checklist before trusting the story.
The more consequential the decision, the more evidence you should require. Changing your lunch order because of one bad meal is low-stakes. Overhauling a business strategy because of one rough week is not.
Evaluating whether a pattern is real comes down to disciplined thinking: measure the observation against a reliable baseline, consider how much data supports it, and check whether the pattern holds up consistently over time. Short-term streaks and spikes are a normal part of randomness, and as we have seen throughout this course, our instinct to read meaning into every fluctuation often leads us astray. By pausing to ask the right questions, you give yourself the best chance of separating genuine signals from everyday noise.
Now it is time to sharpen these skills with hands-on practice! In the upcoming exercises, you will judge real-world scenarios, compare streaks to baselines, identify what extra evidence is needed before drawing conclusions, and craft your own data-driven recommendations. Let us find out how well you can tell the real patterns from the random ones!
