Welcome to Interpreting Risk Without Being Misled! In the first three lessons of this course, you learned that randomness naturally creates streaks and clusters, independent events do not remember what happened before, and apparent patterns need to be judged against a baseline, enough data, and consistency over time. In this lesson, you will learn to:
Define a base rate and explain why it matters when interpreting a test result, alert, or statistic.
Explain why a highly accurate test can still produce mostly false positives when the condition being tested for is rare.
Calculate or estimate how many true positives and false positives we should expect in a large group.
Interpret why individually rare events can still appear often in the news when there are enough people or opportunities for them to occur.
These ideas will complete your probability toolkit and help you think more clearly the next time a statistic, warning, or headline sounds alarming.
📖 Why Accuracy Is Not the Whole Story
Imagine reading a headline: "New airport scanner detects threats with 95% accuracy." That sounds reassuring. Most people would assume that if the scanner flags someone, there is a 95% chance that person is actually carrying something dangerous. But that assumption can be wildly wrong.
One critical missing piece is the base rate — how common the thing we are looking for actually is in the first place. Another is the false-alarm rate — how often the test mistakenly flags someone who is actually clear. Without both, even an impressive accuracy number can lead us to the wrong conclusion. In practice, the base rate is the piece people overlook most often, so it will be our main focus — but keep in mind that knowing the false-alarm rate is also essential. This mistake trips up not just casual readers but also trained professionals, and in the next section we will see exactly why.
📊 Understanding Base Rates
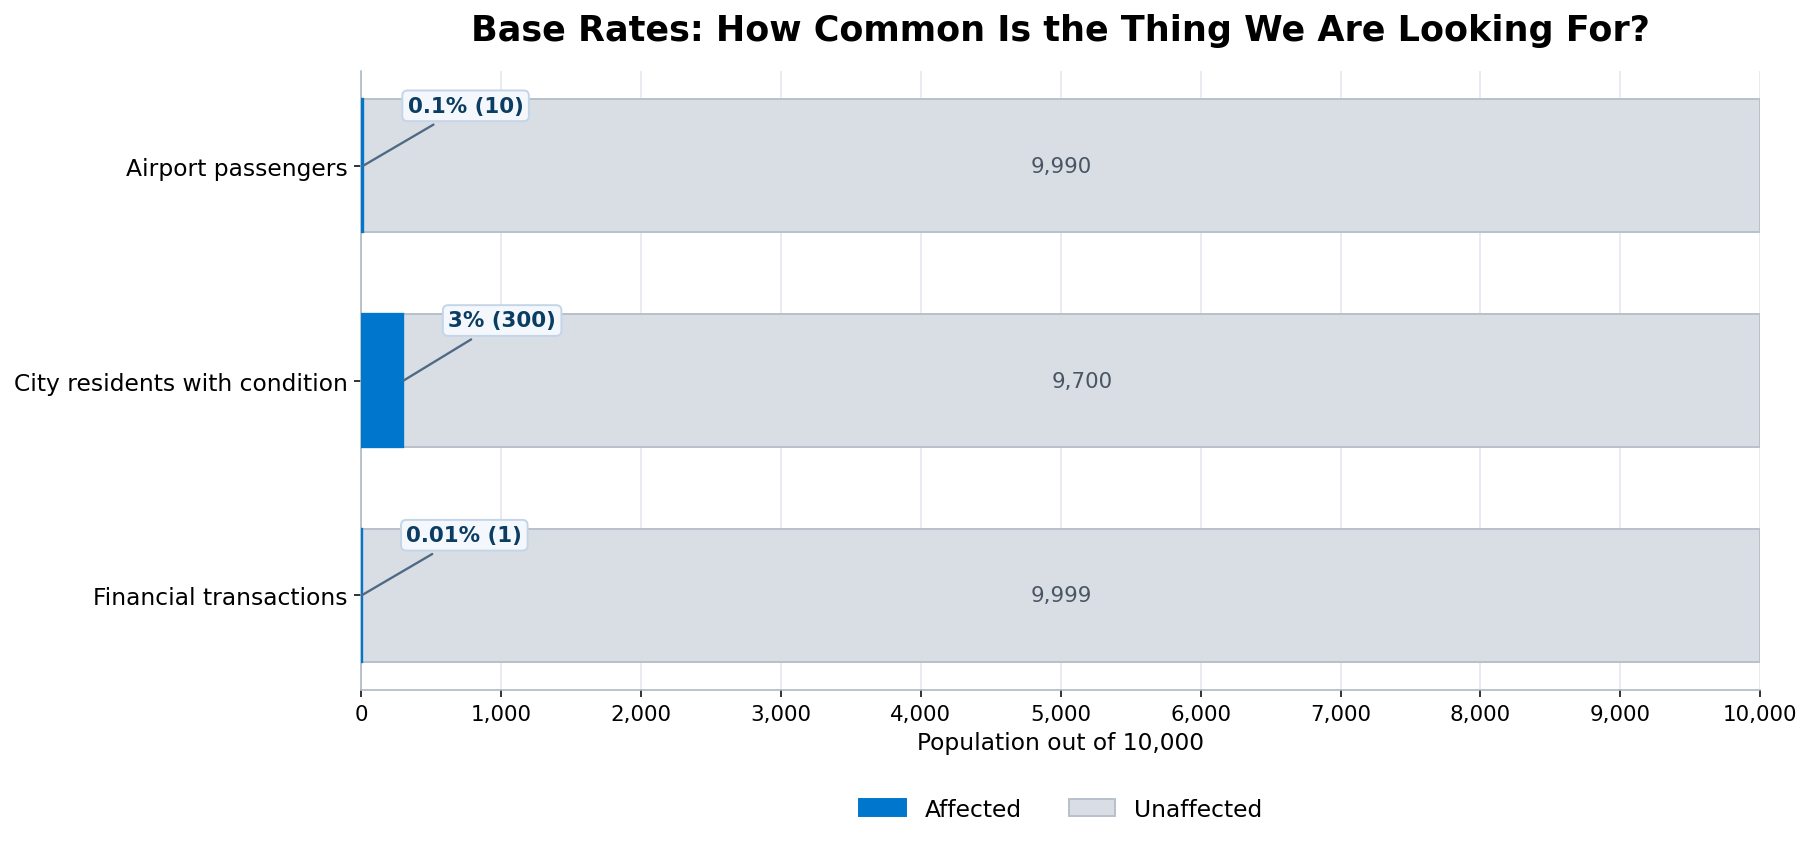
A base rate is how common something is in the full group we are looking at before we use any test, screen, or warning system. You can think of it as the starting odds. If only a small number of people in the group have the condition or behavior we are checking for, the base rate is low. If many people have it, the base rate is high.
For example:
If 1 in every 1,000 airline passengers is carrying a prohibited item, the base rate is 0.1%.
If 3 out of every 100 people in a city have a particular medical condition, the base rate is 3%.
If 1 in 10,000 financial transactions is fraudulent, the base rate is .
🌎 When Rare Events Are Not So Rare
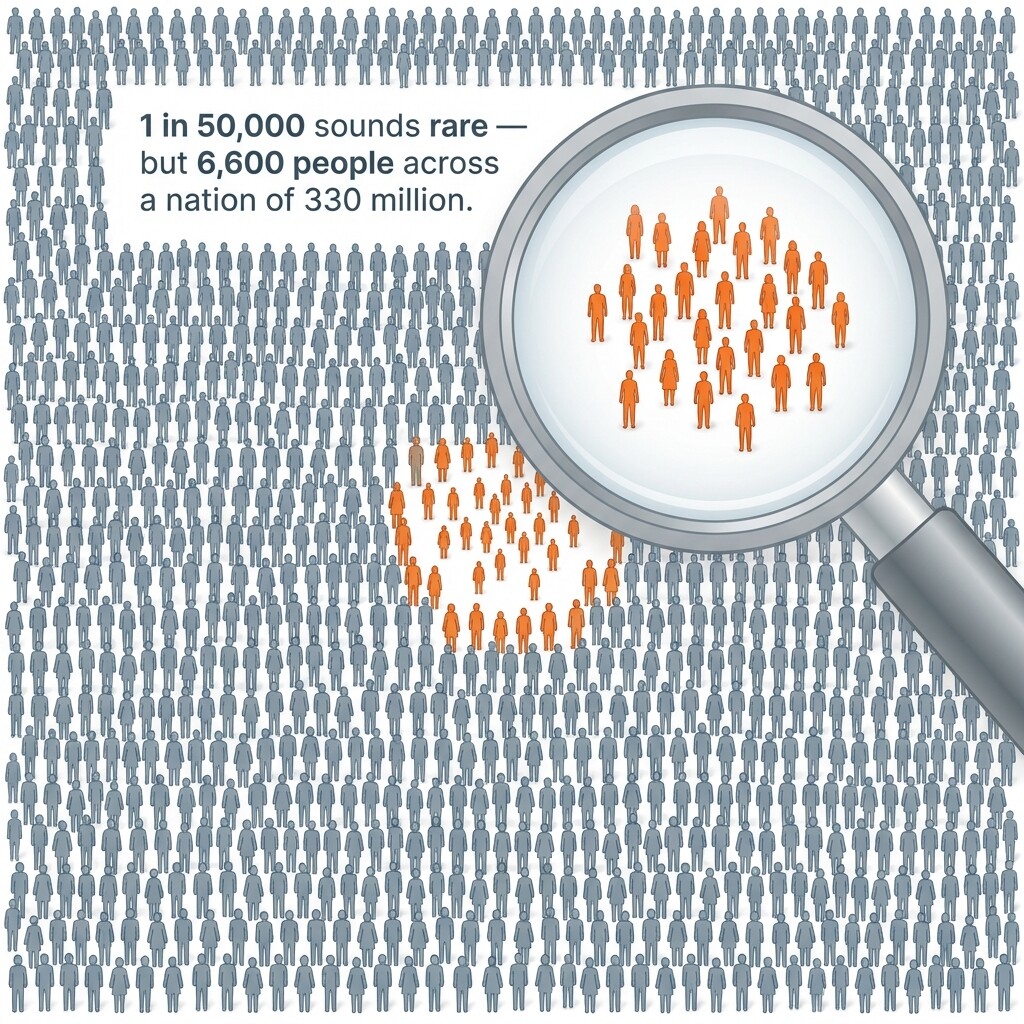
Base rates also help us understand a related phenomenon that regularly makes headlines: individually rare events appearing far more often than we might expect. If a medication side effect strikes only 1 in 50,000 people, it sounds incredibly unlikely on a personal level. But consider what happens at the scale of a large population.
The United States has roughly 330 million people. If the medication were given to the entire population and the side-effect rate is 1 in 50,000, we would expect:
Conclusion and Next Steps
In this lesson, you learned that a test result or alert is only as meaningful as the base rate behind it — when the condition being detected is rare, even accurate tests produce mostly false positives — and that individually rare events stop being surprising once we account for the enormous number of opportunities in the real world.
Up next, you will put all four lessons of this course into practice by spotting missing base rates, calculating false-alarm counts, and estimating how often rare events appear at scale.
Be a part of our community of 1M+ users who develop and demonstrate their skills on CodeSignal
0.01%
Knowing the base rate helps us make sense of any positive result. If the base rate is very low, the thing we are testing for is rare to begin with, and that can strongly affect how we should interpret a test, alert, or warning.
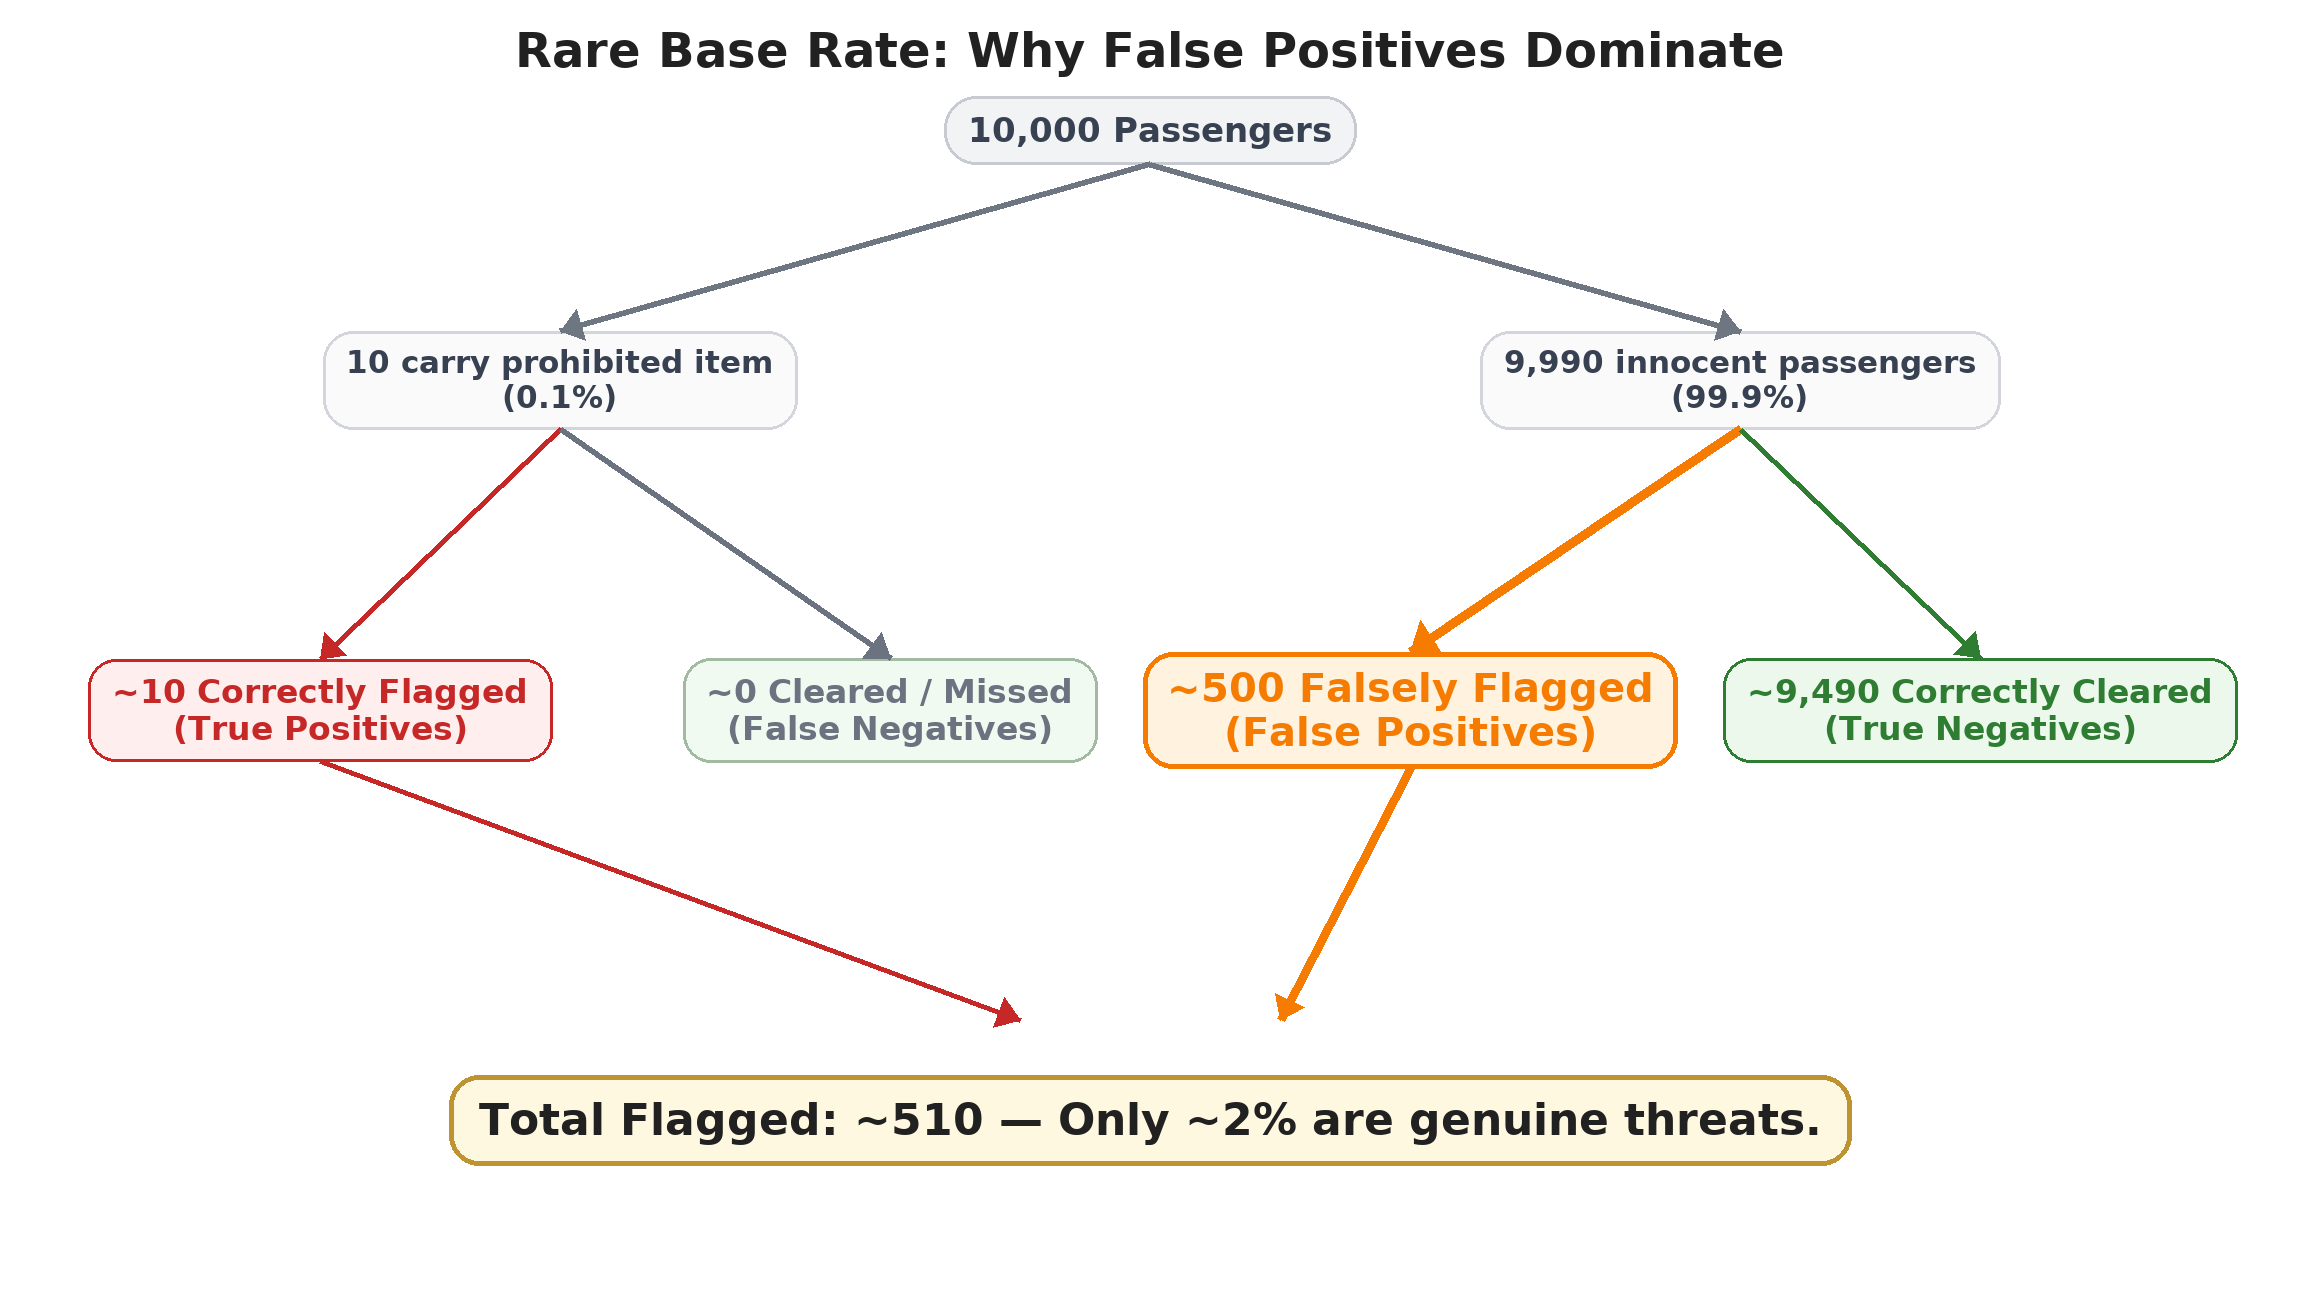
Let us put these ideas together with an example. To make the math easier to follow, we will work with actual counts instead of percentages alone.
Suppose an airport uses a security scanner that is described as 95% accurate. In real life, the word "accurate" is vague. A test's ability to catch real threats and its ability to correctly clear innocent people are two separate numbers that may differ. To keep the example concrete, we will assume both are 95%:
If a passenger is carrying a prohibited item, the scanner flags them 95% of the time (this is the true-positive rate).
If a passenger is not carrying a prohibited item, the scanner correctly clears them 95% of the time (this is the true-negative rate). That also means it falsely flags innocent passengers 5% of the time (the false-positive rate).
Now imagine that 10,000 passengers go through the scanner. Out of those 10,000 passengers, only 10 are actually carrying a prohibited item. That is a base rate of 0.1%.
Let us count what happens.
First, look at the 10 passengers who really are carrying a prohibited item:
10×0.95=9.5≈10 correctly flagged
So the scanner catches about 10 real cases.
Next, look at the 9,990 passengers who are not carrying anything prohibited:
9,990×0.05=499.5≈500 falsely flagged
So about 500 innocent passengers are flagged by mistake.
Now combine those two groups:
About 10 flagged passengers are real cases.
About 500 flagged passengers are false alarms.
That means the scanner flags about:
10+500=510
Out of those 510 flagged passengers, only about 10 are actually carrying a prohibited item. So the share of flagged passengers who are real cases is:
51010≈0.020=2%
So even with a 95% accurate scanner, only about 2% of the people it flags are actually carrying a prohibited item. The other 98% are false alarms.
Group
Count
Flagged
Type
Carrying prohibited item
10
~10
True positives
Not carrying prohibited item
9,990
~500
False positives
Total flagged
~510
~2% genuine
This is the base rate trap: when the condition being tested for is rare, most positive results will be false positives — even when the test itself is good. The large group of innocent passengers, even at a low 5% false-alarm rate, produces far more flags than the tiny group of actual threats. Accuracy alone does not tell us how meaningful a positive result is. We need the base rate and the false-alarm rate to complete the picture. Because the base rate is the factor people forget most often, it will stay at the center of our practice exercises.
50,000330,000,000
=
6,600 cases
That is 6,600 people experiencing the side effect, enough to fill a small arena. Each individual case is genuinely rare, yet thousands of cases appear across the country. News outlets could collect dramatic personal stories, and it might feel like an epidemic, even though the event is happening at exactly the predicted rate.
This logic applies to all kinds of surprising events. A one-in-a-million coincidence sounds extraordinary, but in a country of 330 million people, we should expect roughly 330 such coincidences. As you may recall, our brains tend to see meaning in clusters and outliers. When we combine that instinct with a failure to appreciate just how many opportunities exist for rare events to occur, we end up overreacting to outcomes that are perfectly normal at scale.
Notice the common thread between this idea and the base rate trap: in both cases, the sheer size of the group drives the result. With screening, the enormous group of innocent people generates more false alarms than the tiny group of real threats produces true alarms. With rare events, millions of people create enough opportunities for even a tiny probability to produce thousands of real cases. The next time a headline makes a rare event sound alarming, ask yourself how many people or chances were involved. If the answer is very large, the "surprising" outcome may have been practically inevitable.