Welcome back to Make Sense of Everyday Probabilities! In the previous lesson, you placed events on the 0-to-1 probability scale and connected everyday likelihood words to approximate numeric ranges. That foundation will serve you well here, because now you are going to explore the format you will encounter most often in daily life: percent chances.
Weather apps say "30% chance of rain." A doctor might tell you there is a "15% chance of side effects." A news headline might read "70% chance the project launches on time." These numbers feel more precise than vague words like "probably" or "unlikely," but do we actually know how to read them correctly? In this lesson, you will learn how to make sense of percent chances wherever they appear. By the end, you will be able to:
- Interpret any percent chance as a concrete expected frequency out of 100 similar situations.
- Compare percent probabilities to judge which events are more or less likely.
- Recognize a surprisingly common thinking error — mentally rounding moderate percentages to 0% or 100% — and understand why it leads to poor judgments.
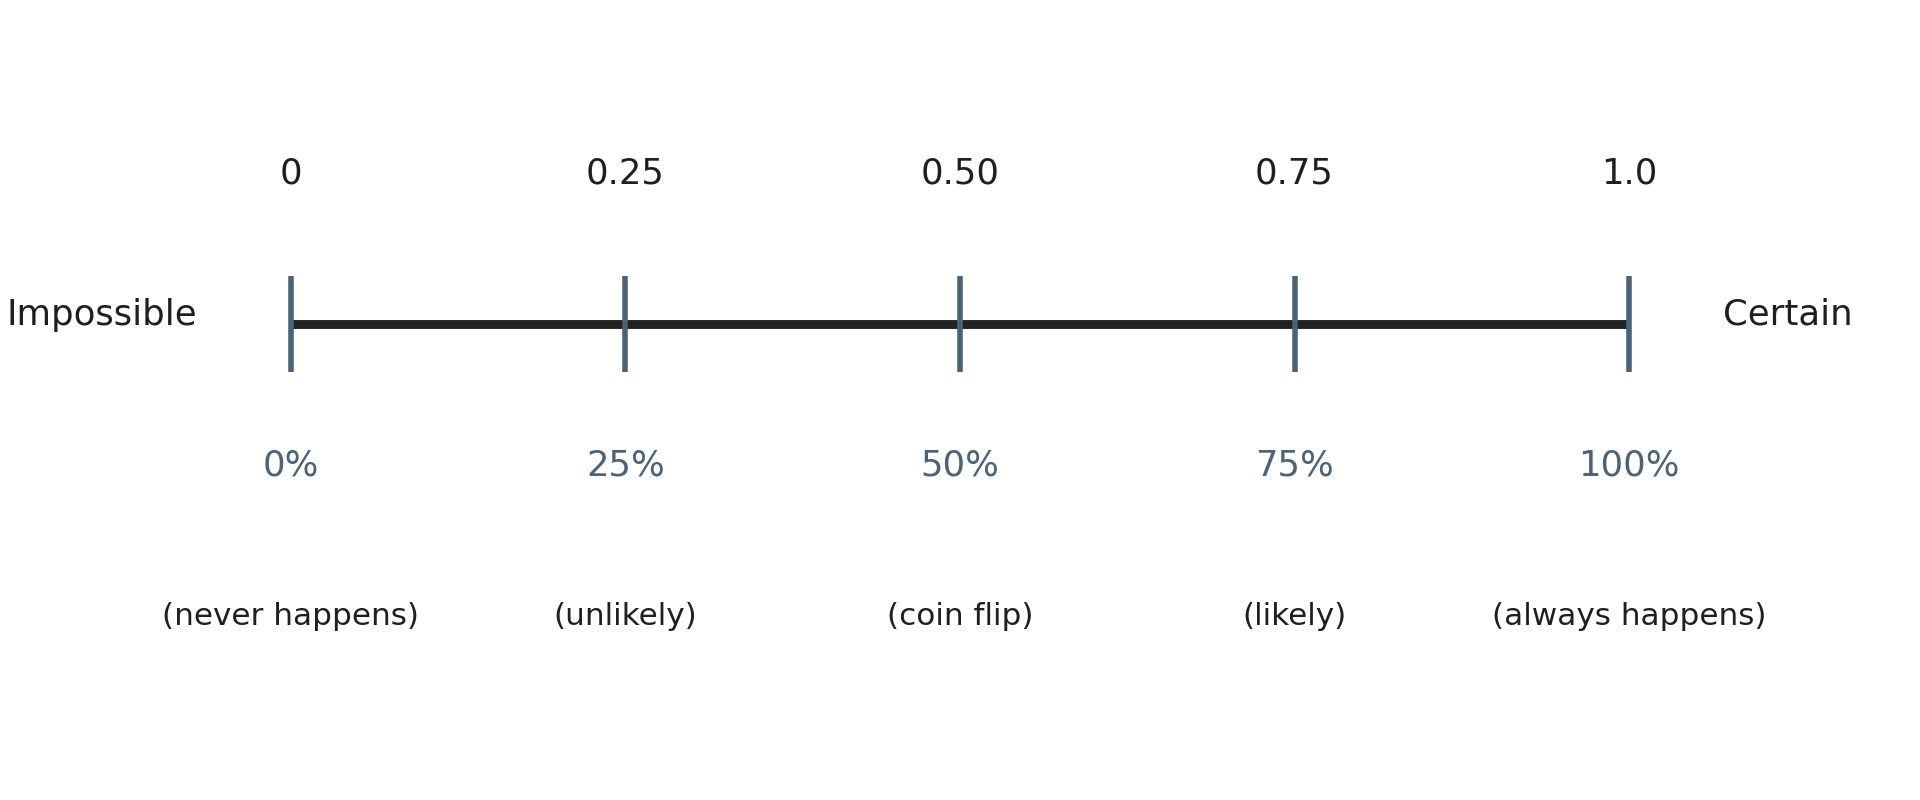
Every probability lives on a scale from to . Percentages are simply another way to express numbers on that same scale. To convert, multiply by :
So a probability of becomes , a probability of becomes , and a probability of becomes . Nothing about the meaning changes, we are just shifting from a decimal format to one that many people find easier to read at a glance. Throughout this lesson, we will work entirely in percentages because that is what you will see most often in the real world.
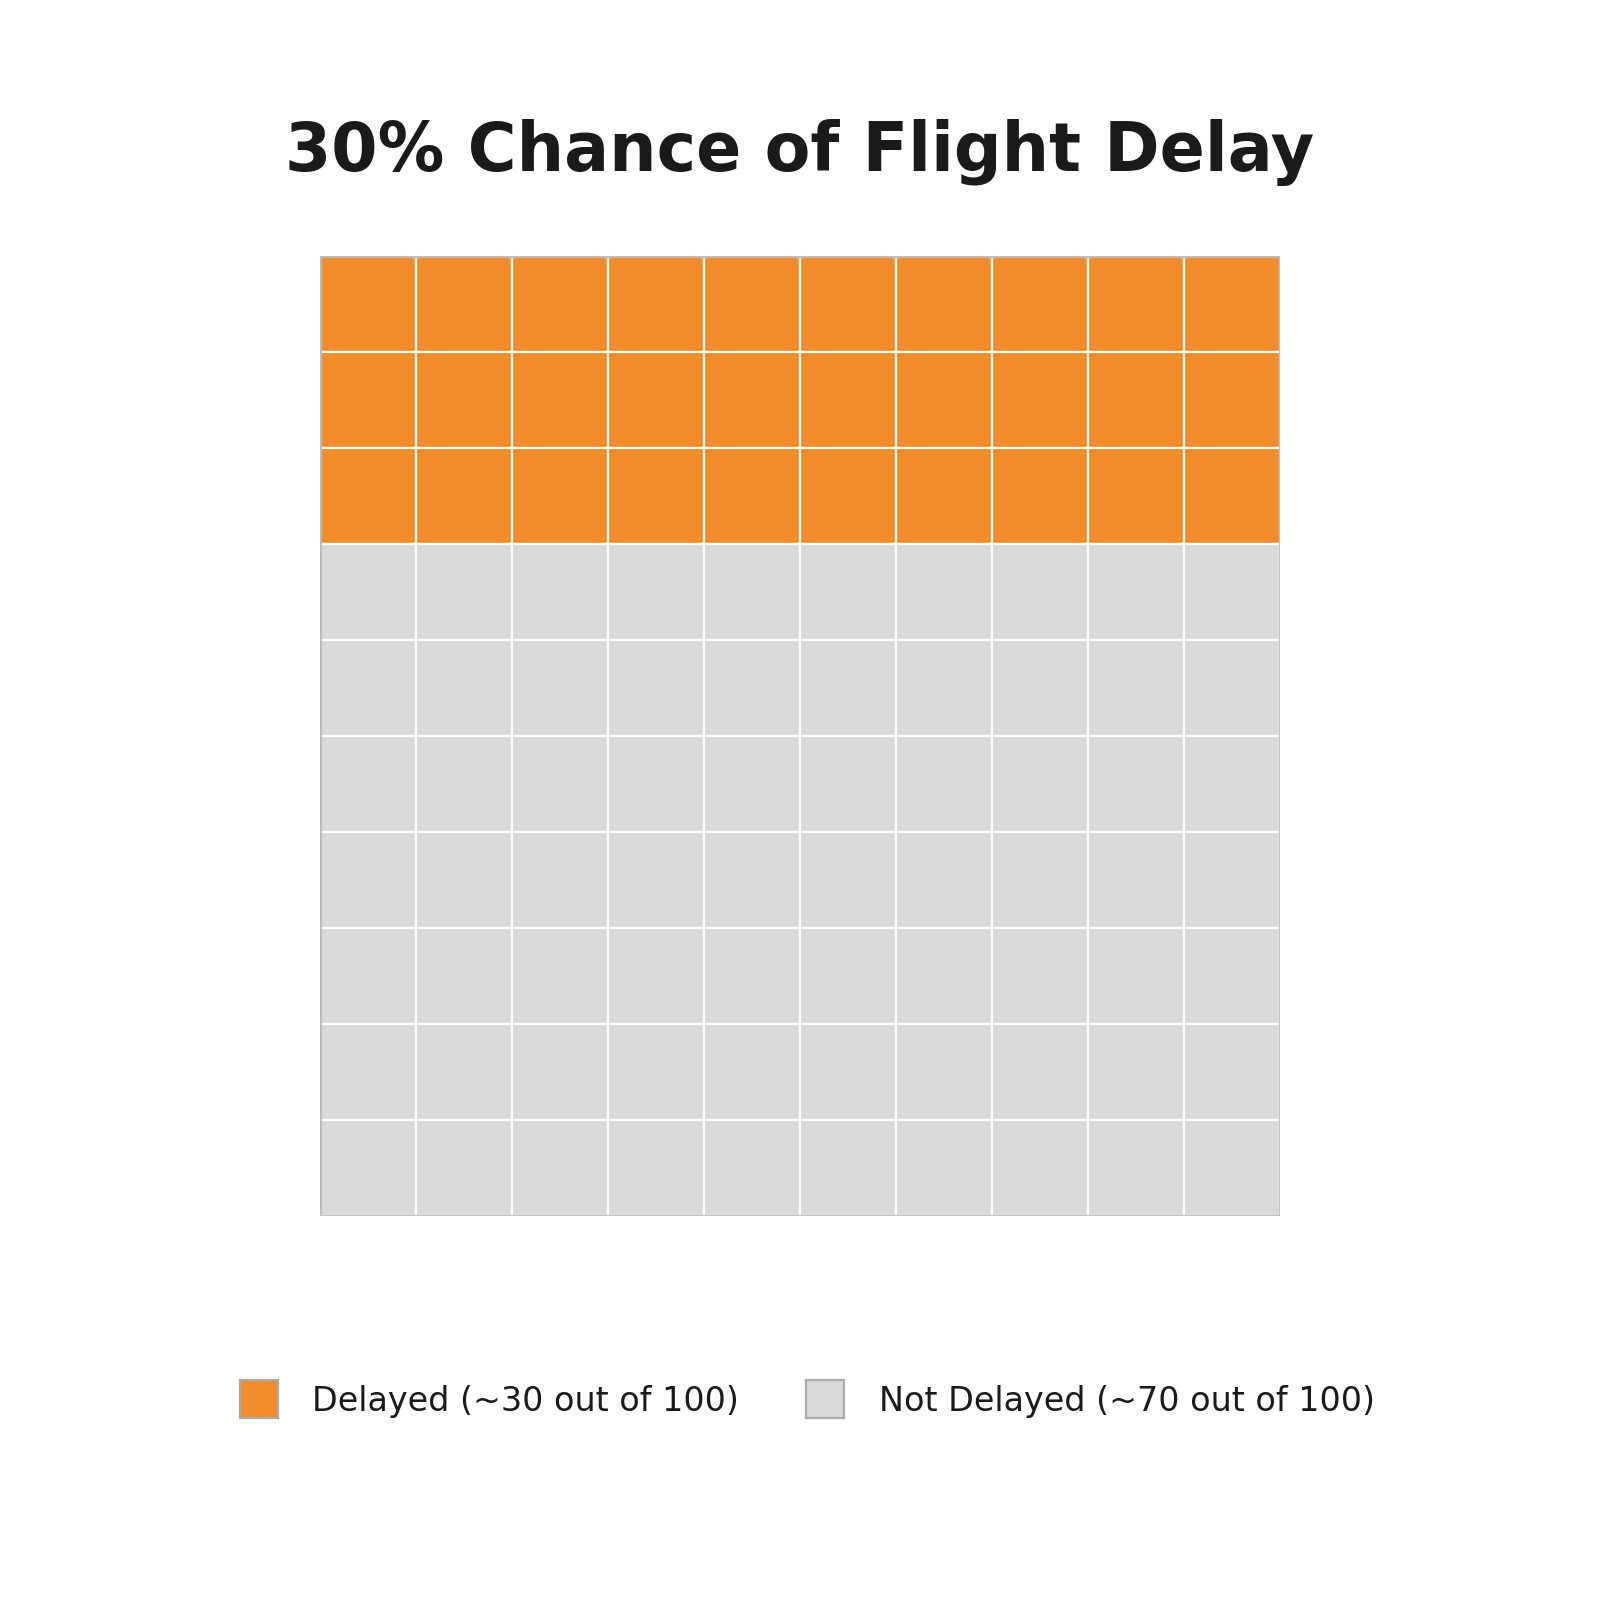
When someone says "there is a 30% chance your flight will be delayed," it is tempting to wonder: so will my flight be delayed or not? The honest answer is that we cannot know for sure, because the statement is about a pattern across many similar situations, not a promise about one single event.
Here is the most useful way to think about it: a 30% chance means that if we could replay this situation 100 times, we would expect the event to happen in about 30 of those 100 cases. The other roughly 70 times, it would not happen. That is the core idea behind every percent probability.
So when a weather forecast says there is a chance of rain tomorrow, picture 100 days with conditions just like tomorrow. On roughly 40 of those days, it rains. On roughly 60, it stays dry. This "imagine 100 similar situations" technique turns an abstract percentage into something concrete and countable.
Once you can read a single percent chance, comparing two or more of them is straightforward: the higher the percentage, the more likely the event. This follows directly from the probability scale, just expressed in a different format.
Suppose you read the following two statements:
- "There is a 15% chance a promotional coupon will arrive in your mailbox this week."
- "There is a 40% chance the store near you is running a sale this weekend."
Which event is more likely? The store sale at is more likely than the coupon at , because . In our "imagine 100 times" picture, the sale would happen in about 40 cases, while the coupon would show up in only about 15. Comparing percent chances works just like comparing any other numbers, and it gives us a clear, objective way to rank how likely different events are.
When the percentages are close together, say versus , the events are nearly equally likely and neither one has a strong edge. When the gap is large, say versus , the difference in likelihood is dramatic. Keeping this sense of scale helps you make better everyday judgments.
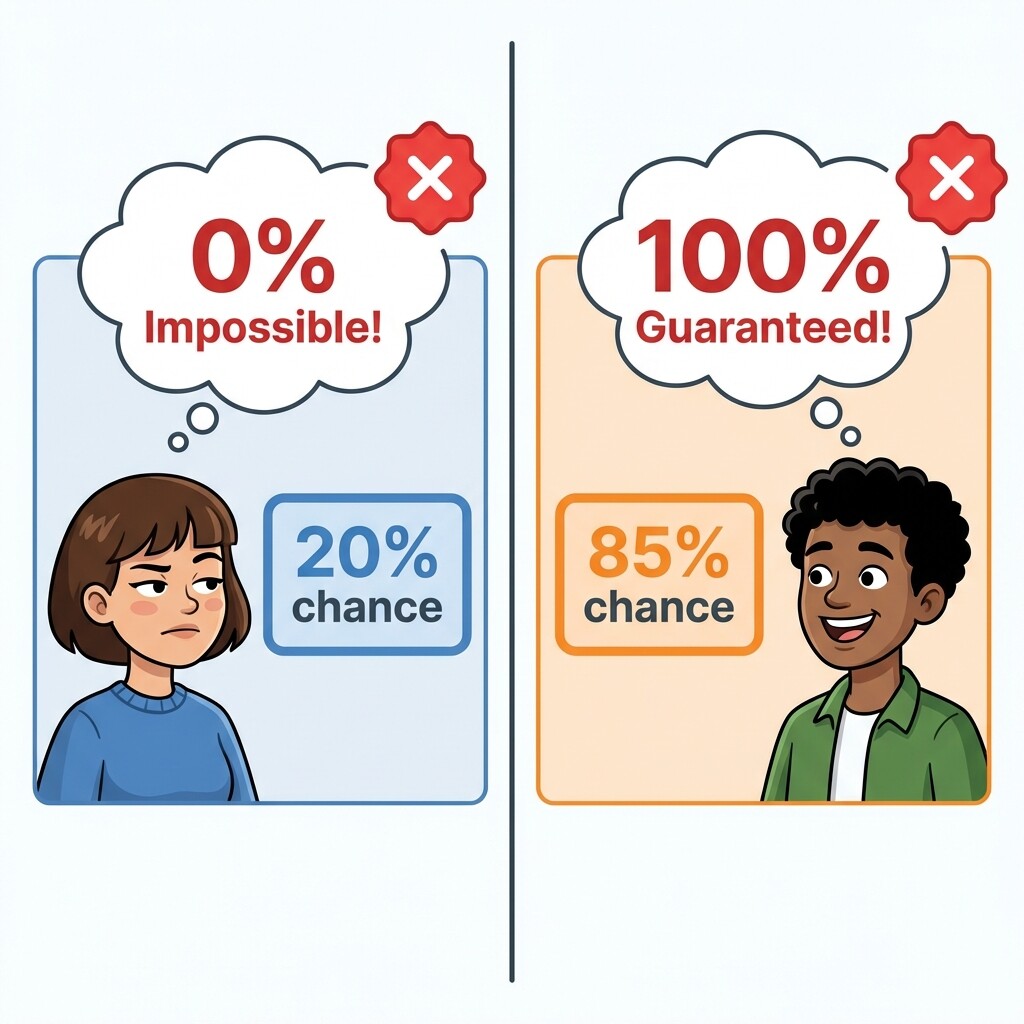
Now let's talk about a mistake that comes up all the time. People have a strong tendency to mentally round percentages toward the extremes. When they hear a probability that is not very high, they treat it as if it were . When they hear one that is fairly high, they treat it as if it were .
Consider these two reactions:
- "There's only a 20% chance of a side effect, so it basically won't happen to me."
- "There's an 85% chance of approval, so I'm definitely getting approved."
Both of these are reasoning errors. A chance is not zero. Out of 100 people in the same situation, about 20 of them will experience that side effect — roughly 1 in every 5, which is far from negligible. Likewise, an chance is not . About 15 out of every 100 applicants in that scenario would get approved. Treating as a guarantee means ignoring those 15 cases entirely.
Let's walk through a realistic example that combines everything from this lesson. Imagine you are planning a weekend outing and check two forecasts:
- "There is an 80% chance of warm weather on Saturday."
- "There is a 25% chance of warm weather on Sunday."
How should we read these? The first statement means that out of 100 Saturdays with conditions like this one, about 80 would be warm and about 20 would not. Warm weather is the most likely outcome, but it is not guaranteed since roughly 1 in 5 similar Saturdays would turn out cool. The second statement means that out of 100 Sundays with similar conditions, only about 25 would be warm. That is a real possibility, but most of the time — about 75 out of 100 — Sunday would not be warm.
We can also compare: warm weather on Saturday () is far more likely than warm weather on Sunday (). Notice that this comparison is straightforward because both percentages describe the same kind of thing — the chance of warm weather on a given day. When you compare percent chances, make sure they refer to the same type of outcome and the same reference group. A statement like "80% of weekends have at least one warm day" and "25% of warm days fall on a Sunday" would use different reference groups, and placing those numbers side by side would be misleading.
And neither outcome here is a sure thing. Reading percent chances this way — translating to frequencies, comparing carefully, and resisting the urge to round — gives you a much clearer picture of what to actually expect.
We can also compare: renewal () is far more likely than receiving the bonus discount (). And neither outcome is a sure thing. Reading percent chances this way — translating to frequencies, comparing, and resisting the urge to round — gives you a much clearer picture of what to actually expect.
In this lesson, you learned to interpret any percent chance as an expected frequency out of 100 similar situations, practiced comparing percent probabilities to judge which events are more likely, and identified the common trap of mentally rounding moderate probabilities to or . The key habit to build is simple: whenever you see a percentage, picture 100 cases and count how many times the event would happen.
Now it is time to put these skills into action with a set of practice exercises that will have you translating, comparing, and critically evaluating percent chances drawn from everyday life. Let's see how sharp your new probability-reading instincts are!