You are making stellar progress! In the first two lessons, you placed events on the 0-to-1 probability scale and then learned to read percent chances as expected frequencies out of 100 similar situations. Both of those skills will come in handy in this lesson.
Here is the challenge: probability does not always arrive neatly packaged as a percentage. You will often encounter phrases like "1 in 20 customers win a prize" or "the odds are 4 to 1." These look quite different from a percent chance, yet they describe the same kind of thing — how likely something is. By the end of this lesson, you will be able to:
- Recognize the three most common probability formats: percentages, "1 in N" statements, and simple odds.
- Convert between these formats using straightforward formulas.
- Compare probability statements even when they are expressed in different formats.
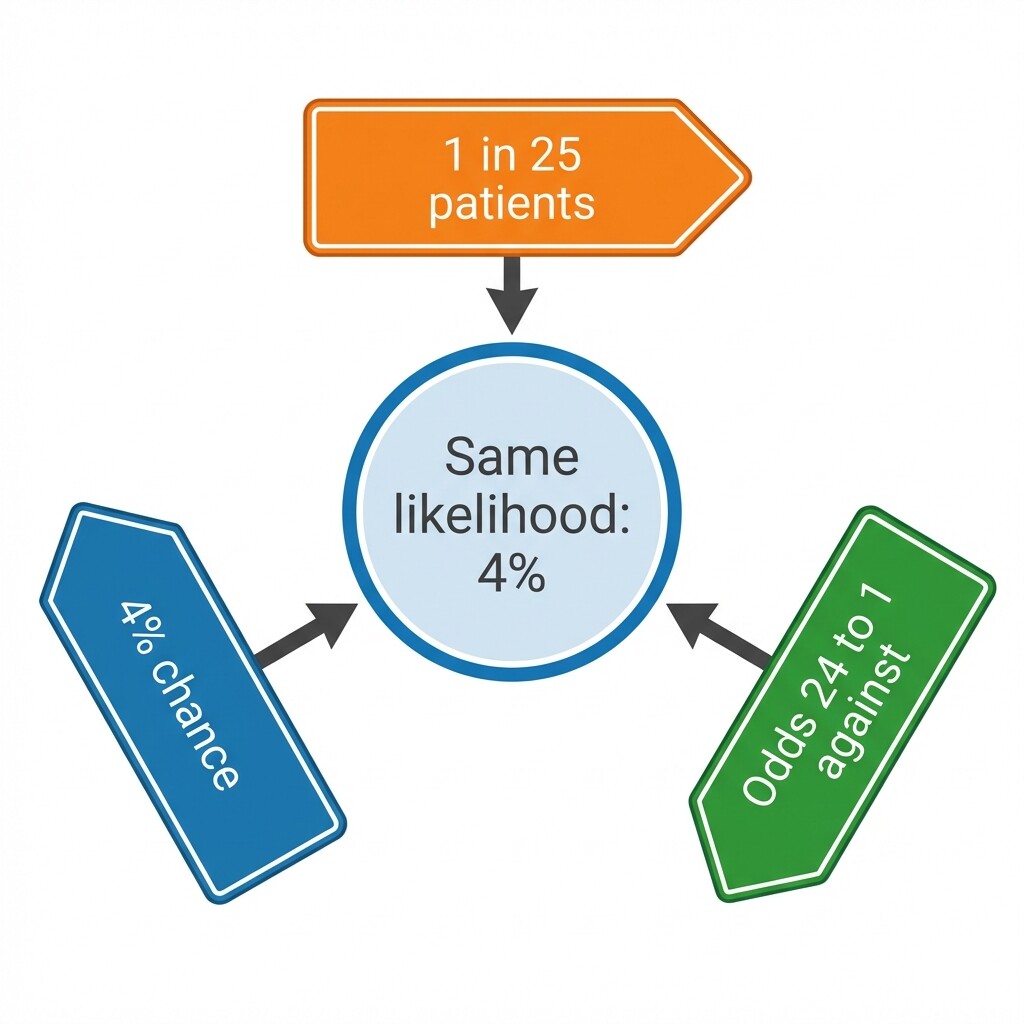
Imagine you are researching a medical procedure and three sources describe the risk of a complication differently:
- Source A: "There is a 4% chance of a complication."
- Source B: "1 in 25 patients experience a complication."
- Source C: "The odds are 24 to 1 against having a complication."
At first glance, these might look like three different risk levels. In fact, they are all saying the exact same thing — only the format changes. This is one reason probability can feel confusing in everyday life: identical likelihoods can appear very different depending on how they are written. Our goal in this lesson is to make each of these formats feel familiar and to build the skill of translating freely between them.
Beyond percentages, one of the most common ways to express probability is the "1 in N" format. You will find it in health information, product statistics, and news reporting — in statements like "1 in 5 adults exercise daily" or "1 in 1,000 patients report this side effect."
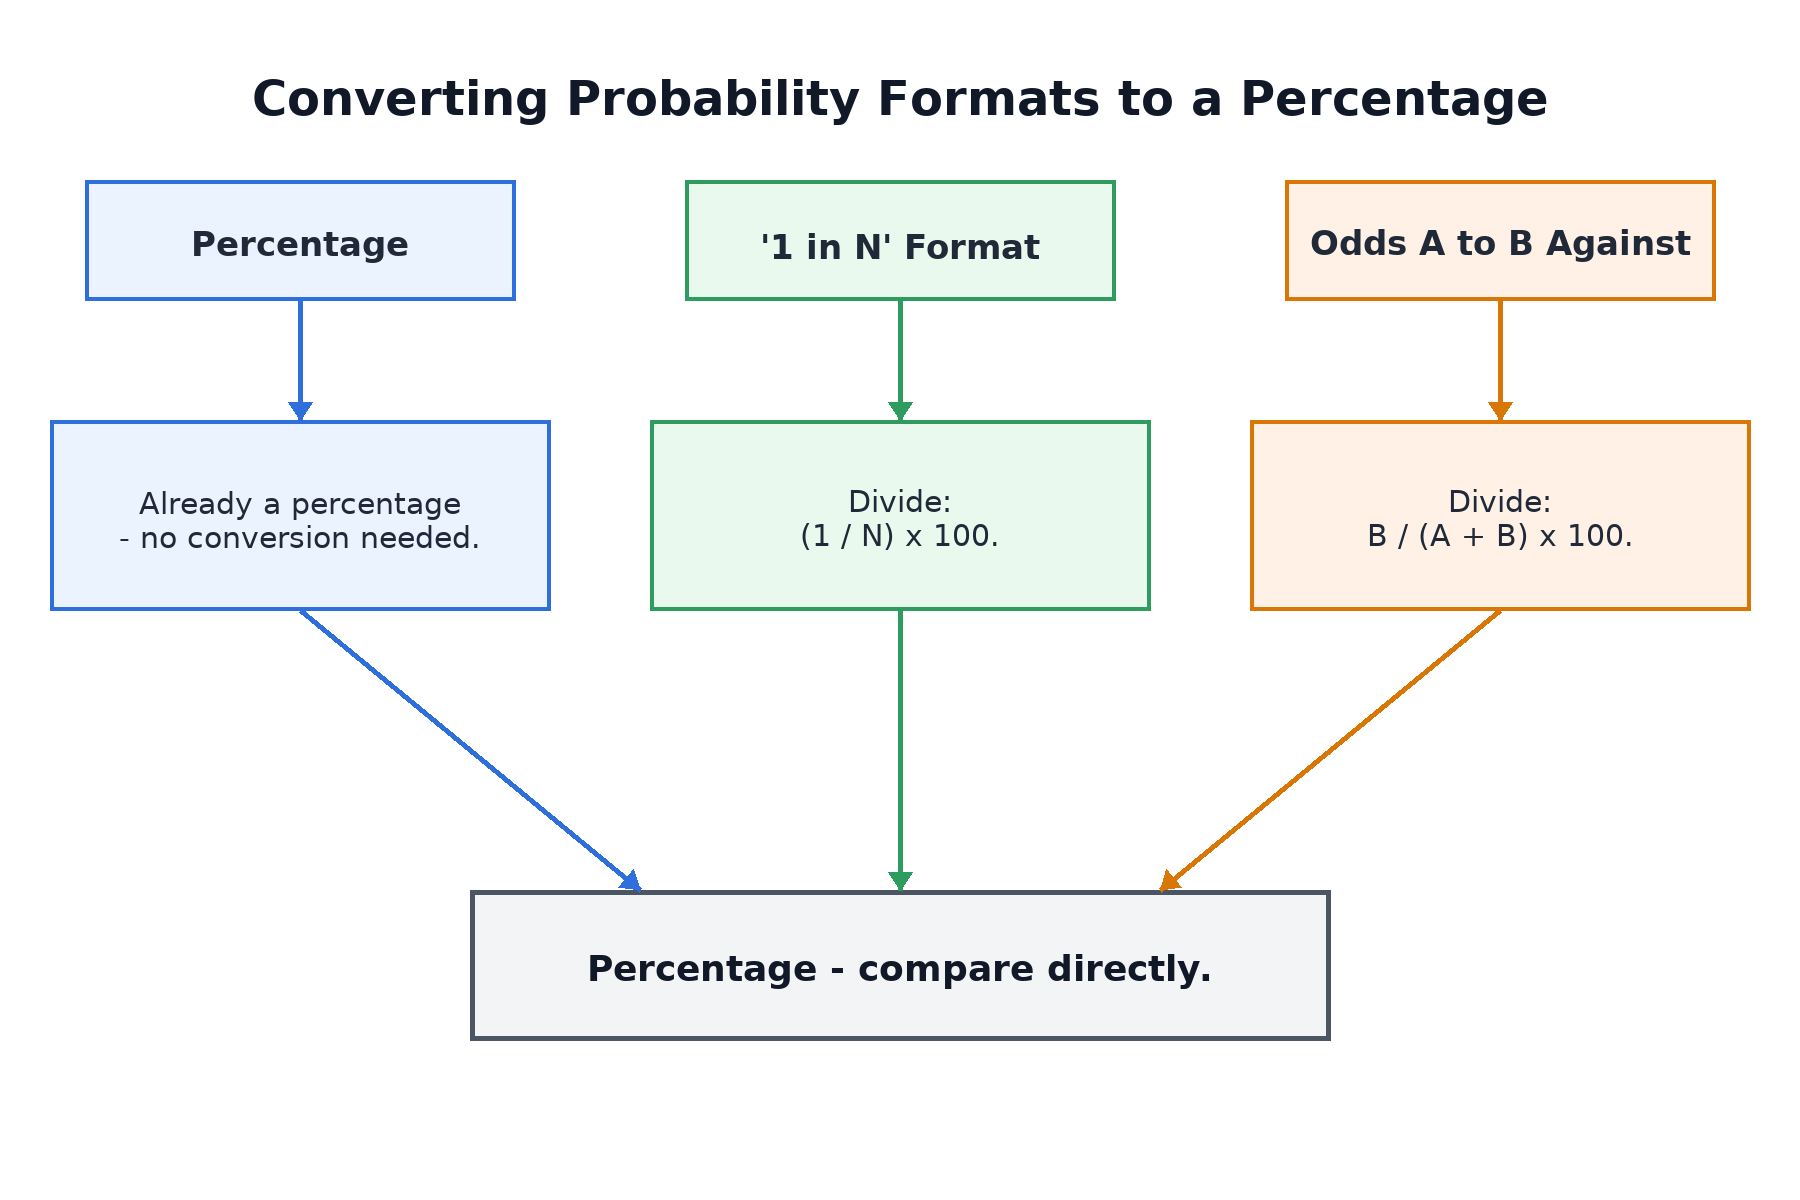
The meaning is straightforward: out of every cases, we expect the event to happen about 1 time. We can connect this format to the percentage thinking we practiced in the previous lesson with a simple conversion:
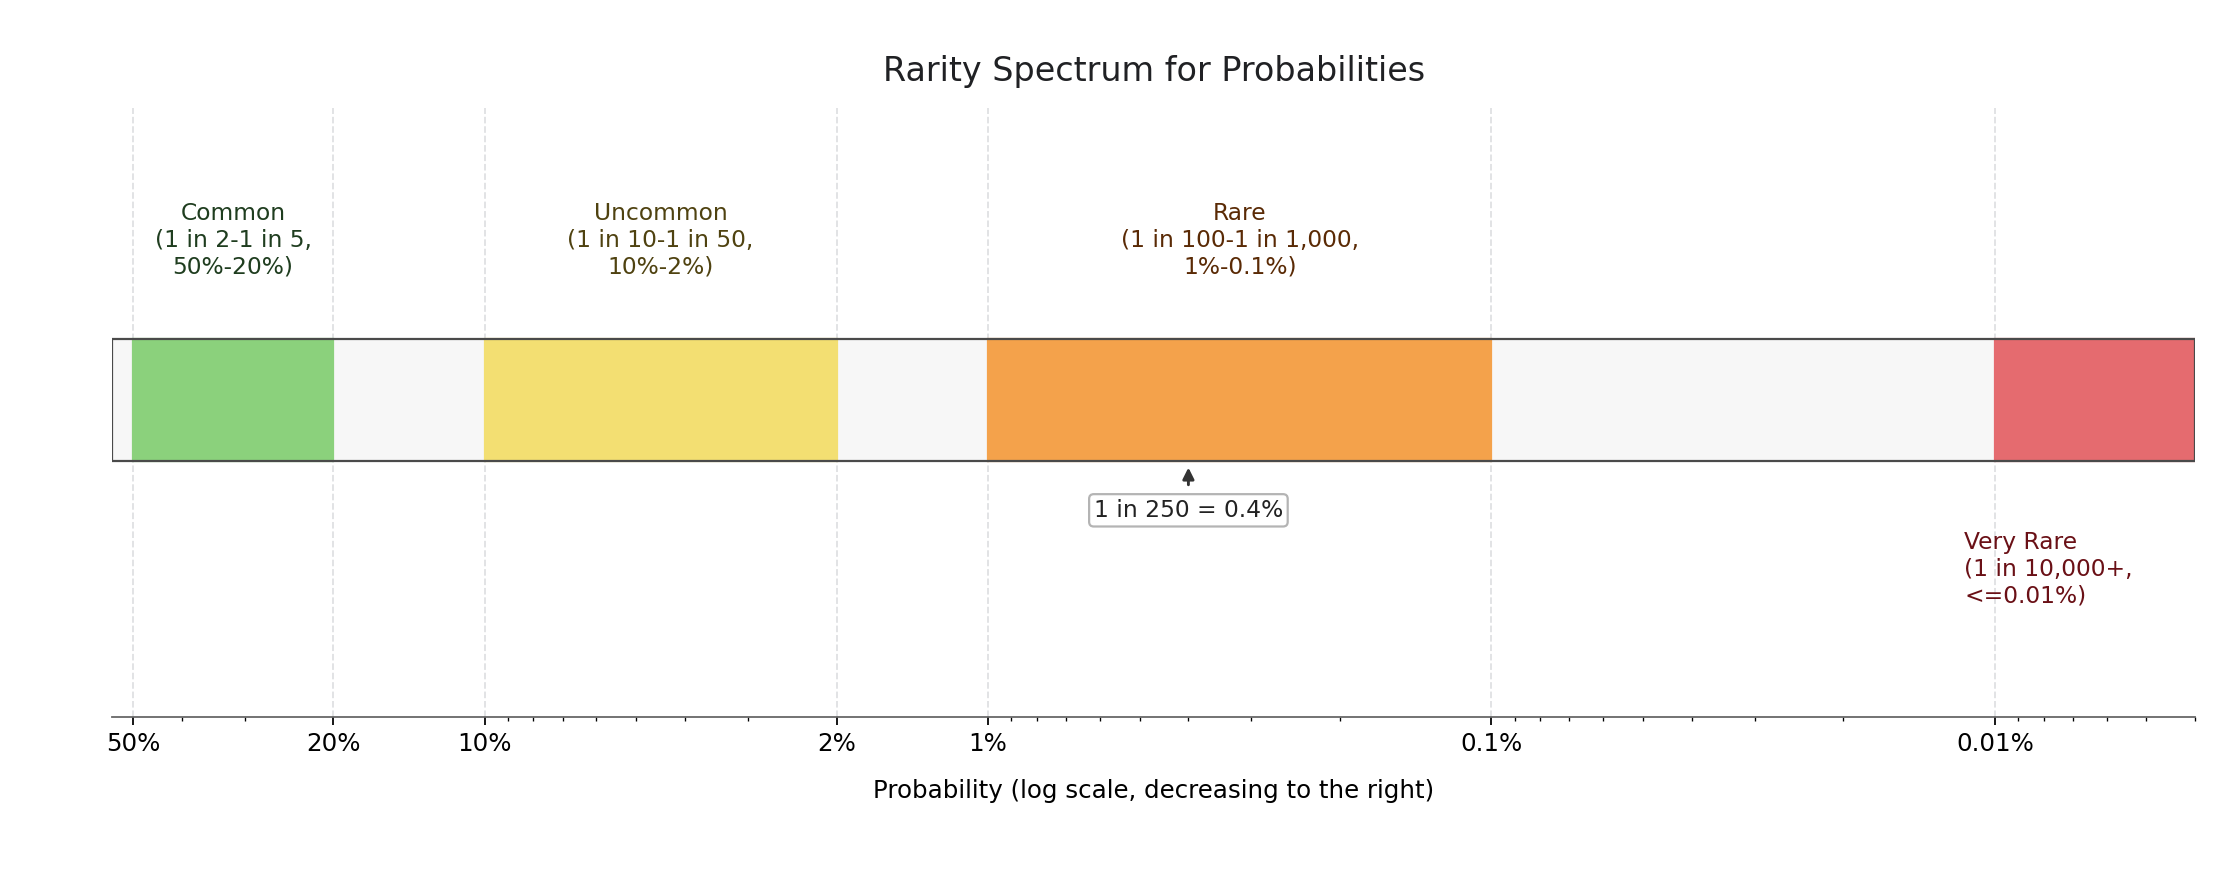
When we encounter a "1 in N" statement, it helps to have some rough benchmarks for how common or uncommon the event actually is:
- 1 in 2 through 1 in 5 ( to ): Common. You would see this happen regularly.
- 1 in 10 through 1 in 50 ( to ): Uncommon. In a group of 100 people, only a few would be affected, but it would not be surprising.
- 1 in 100 through 1 in 1,000 ( to ): Most individuals will not experience it, though across a large population many still will.
The third format we need to recognize is odds, which shows up frequently in sports commentary, betting, and sometimes in news stories. Odds express likelihood as a ratio between two outcomes, written as "A to B."
Here is the key idea: the first number represents how often the event does not happen, and the second represents how often it does. When someone says the odds are "3 to 1 against" an event, it means that for every 3 times the event does not occur, it occurs about 1 time. The total number of outcomes is , and the event happens in 1 of them. In casual speech, people often drop the word "against" and simply say "3 to 1 odds," which typically carries the same meaning.
To convert odds to a percentage, add the two numbers together, then divide the favorable side by that total:
The real power of knowing these conversions is that we can compare probabilities even when they are stated in completely different formats. The strategy is simple: convert everything to percentages and then compare the numbers directly.
Let's walk through a realistic example. Suppose you are comparing two product warranties that describe repair likelihood in different formats:
In this lesson, we explored three common formats for expressing probability — percentages, "1 in N" statements, and simple odds — and saw that these are simply different ways of describing the same underlying likelihood. We learned conversion formulas that let us move freely between them, and we built a sense of scale for judging whether a "1 in N" event counts as common, uncommon, or rare.
The key insight to carry forward is this: the format may change, but the likelihood does not. Recognizing and translating each format gives you a much clearer view of the information being presented. Now it is time to put these skills into action with hands-on exercises where you will identify formats, convert between them, and make real comparisons drawn from everyday scenarios.