In the previous lesson, you created your first Grafana dashboard with multiple panels monitoring various metrics. You learned how to write queries that Grafana understands and how to organize visualizations on a single screen. However, if you look closely at your queries, you'll notice something that limits their usefulness: hard-coded values directly in the query filters.
Imagine you're building a dashboard to monitor web traffic across different pages of your website. You create a panel showing the number of hits for your homepage by writing WHERE path = '/' in your query. This works fine for that one page, but what happens when you want to check your login page, product pages, or API endpoints? You have two options, and neither is ideal. First, you could create separate panels for every page you want to monitor—one for /, another for /login, another for /products, and so on. With dozens or hundreds of routes, your dashboard would become impossibly long and difficult to navigate. Second, you could keep the hard-coded WHERE path = '/' value, but that means you can only see metrics for the homepage. To check another page, you'd have to edit the query, save the dashboard, and repeat this process every time you need to switch perspectives.
The solution to this problem is template variables. Template variables transform your static dashboards into interactive ones by adding dropdown selectors at the top of the screen. Instead of hard-coding values or duplicating panels, you create a single set of panels that dynamically filter based on user selections. When someone selects "/products" from a dropdown menu, all panels on the dashboard instantly update to show traffic data for that page. This approach scales effortlessly, whether you're monitoring three pages or three hundred.
Now let's look at the table where this web traffic data is stored. Your PostgreSQL database contains a table called web_traffic that logs HTTP requests to your website. Here's what the table structure looks like:
Every minute, this table records how many requests each page on your website received. If you were to query the most recent data, you might see results like this:
The ts column contains the timestamp, the path column shows which page was accessed (like /, /login, or /products), and the hits column counts how many requests that page received during that minute. Your website has seven main pages being tracked, and new data arrives every minute for each page.
To visualize traffic for your homepage, you would write a query like this:
Template variables in Grafana come in several types, but the most powerful and commonly used are query variables. A query variable is simply a SQL query that runs against your data source and uses the results to populate a dropdown menu. When you write a query that returns a list of web paths, Grafana automatically converts those results into selectable options that appear at the top of your dashboard.
Query variables differ from manual variables, where you type out each option by hand. With query variables, the dropdown options stay synchronized with your actual data. If you add a new page to your website and it starts receiving traffic, that page will automatically appear in the dropdown the next time the query runs. You never have to manually update the list of available options.
These variables appear at the top of your dashboards as dropdown menus with labels like "Page" or "Endpoint." When a user clicks the dropdown and selects a value, Grafana stores that selection and makes it available to use in all your panel queries. The selected value can filter WHERE clauses, become part of panel titles, or even determine which data source a panel queries. For now, we'll focus on the most common use case: filtering panel queries to show data for the selected page.
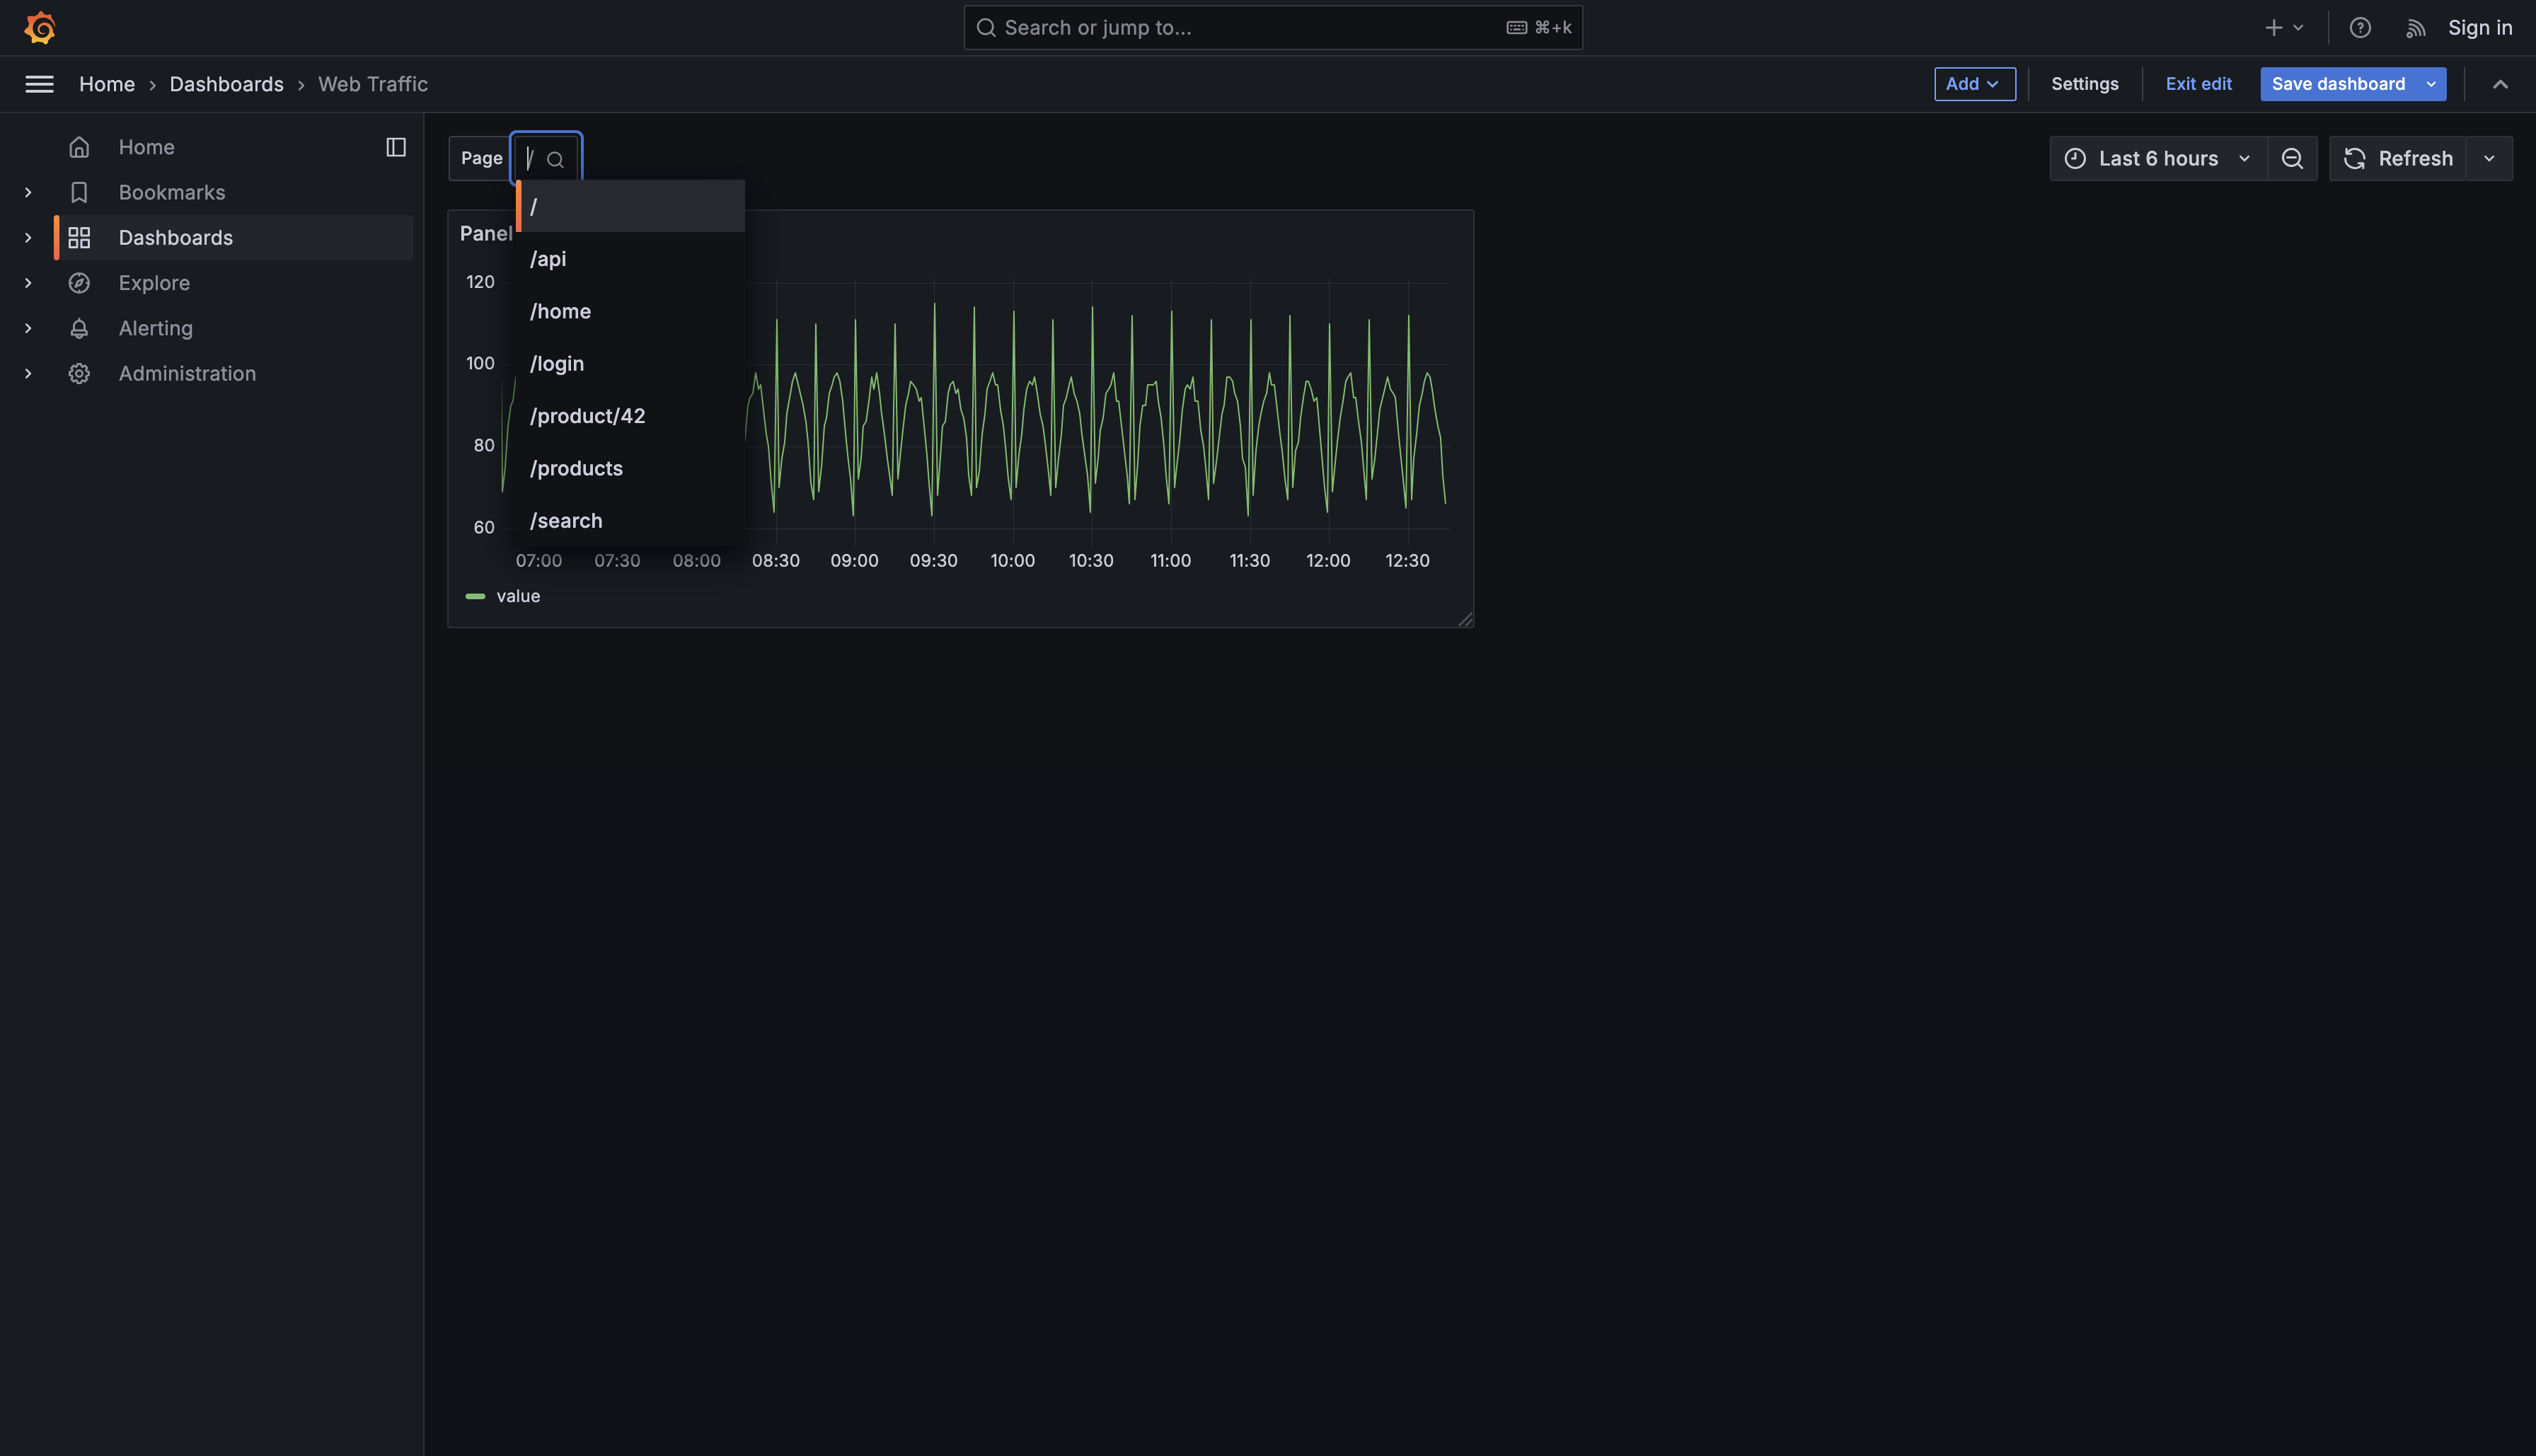
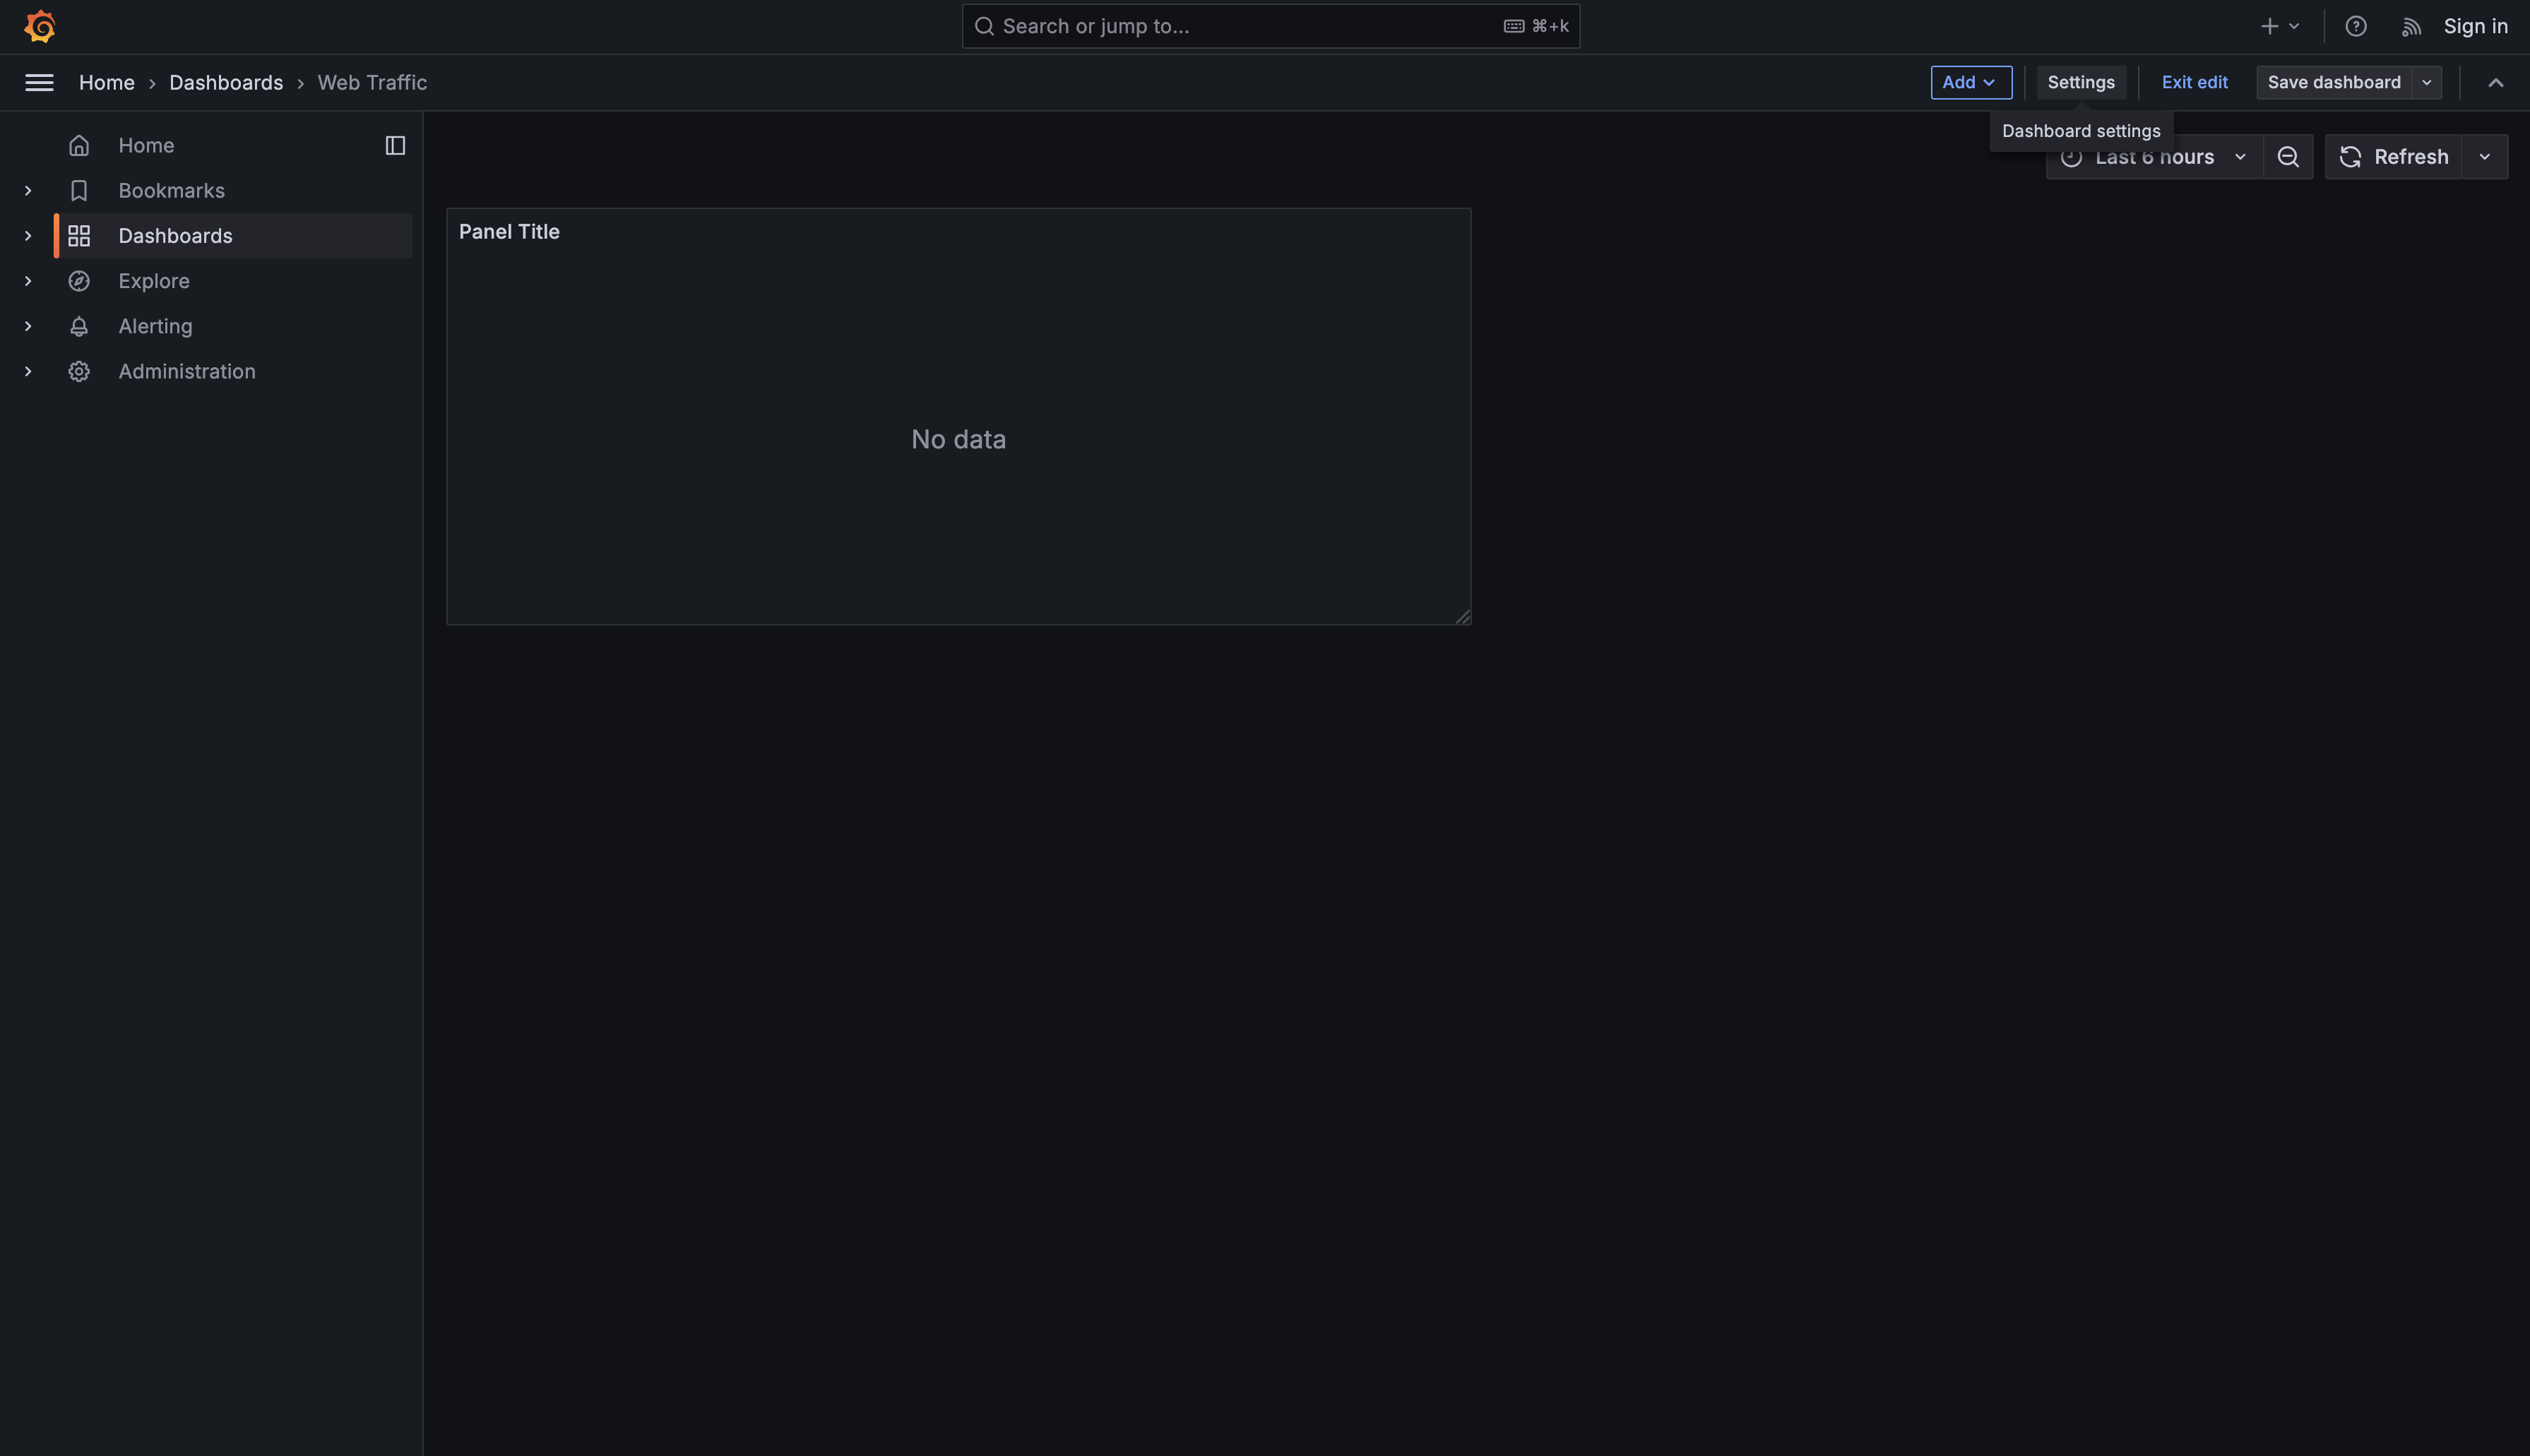
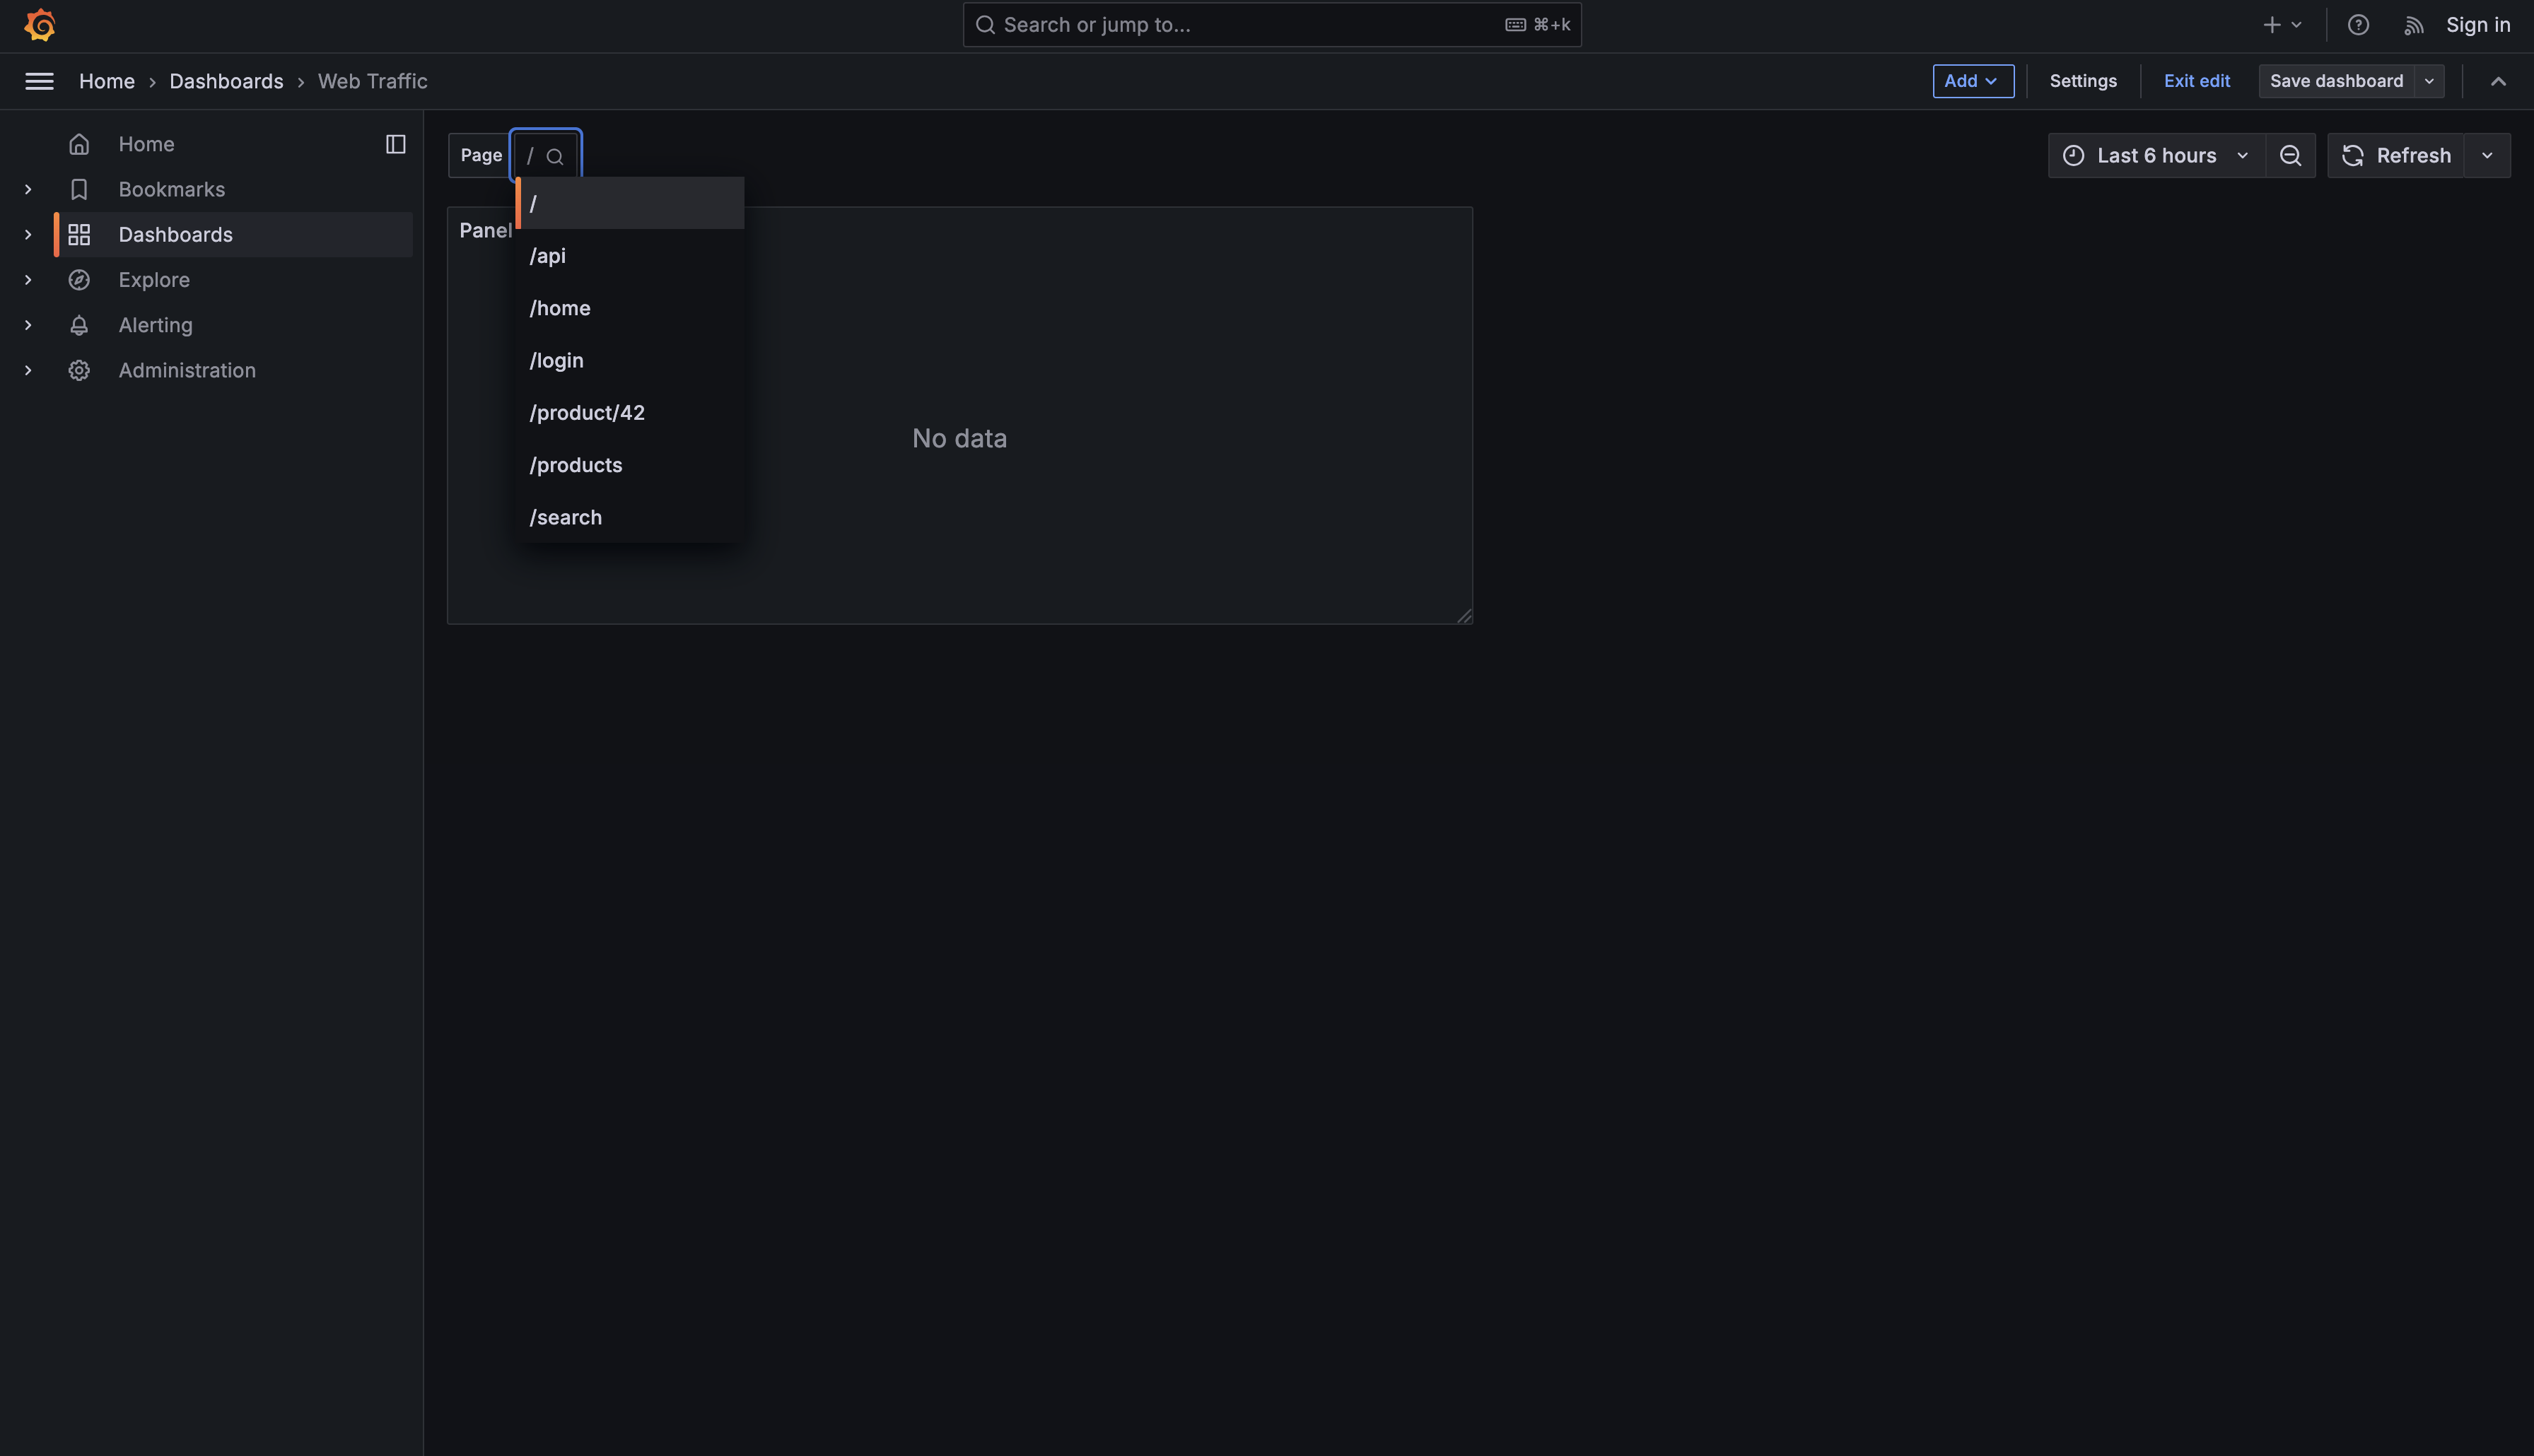
Let's create a variable that will populate a dropdown with all the page paths from your web traffic data. Navigate to your dashboard and click the Settings gear icon in the top right corner.
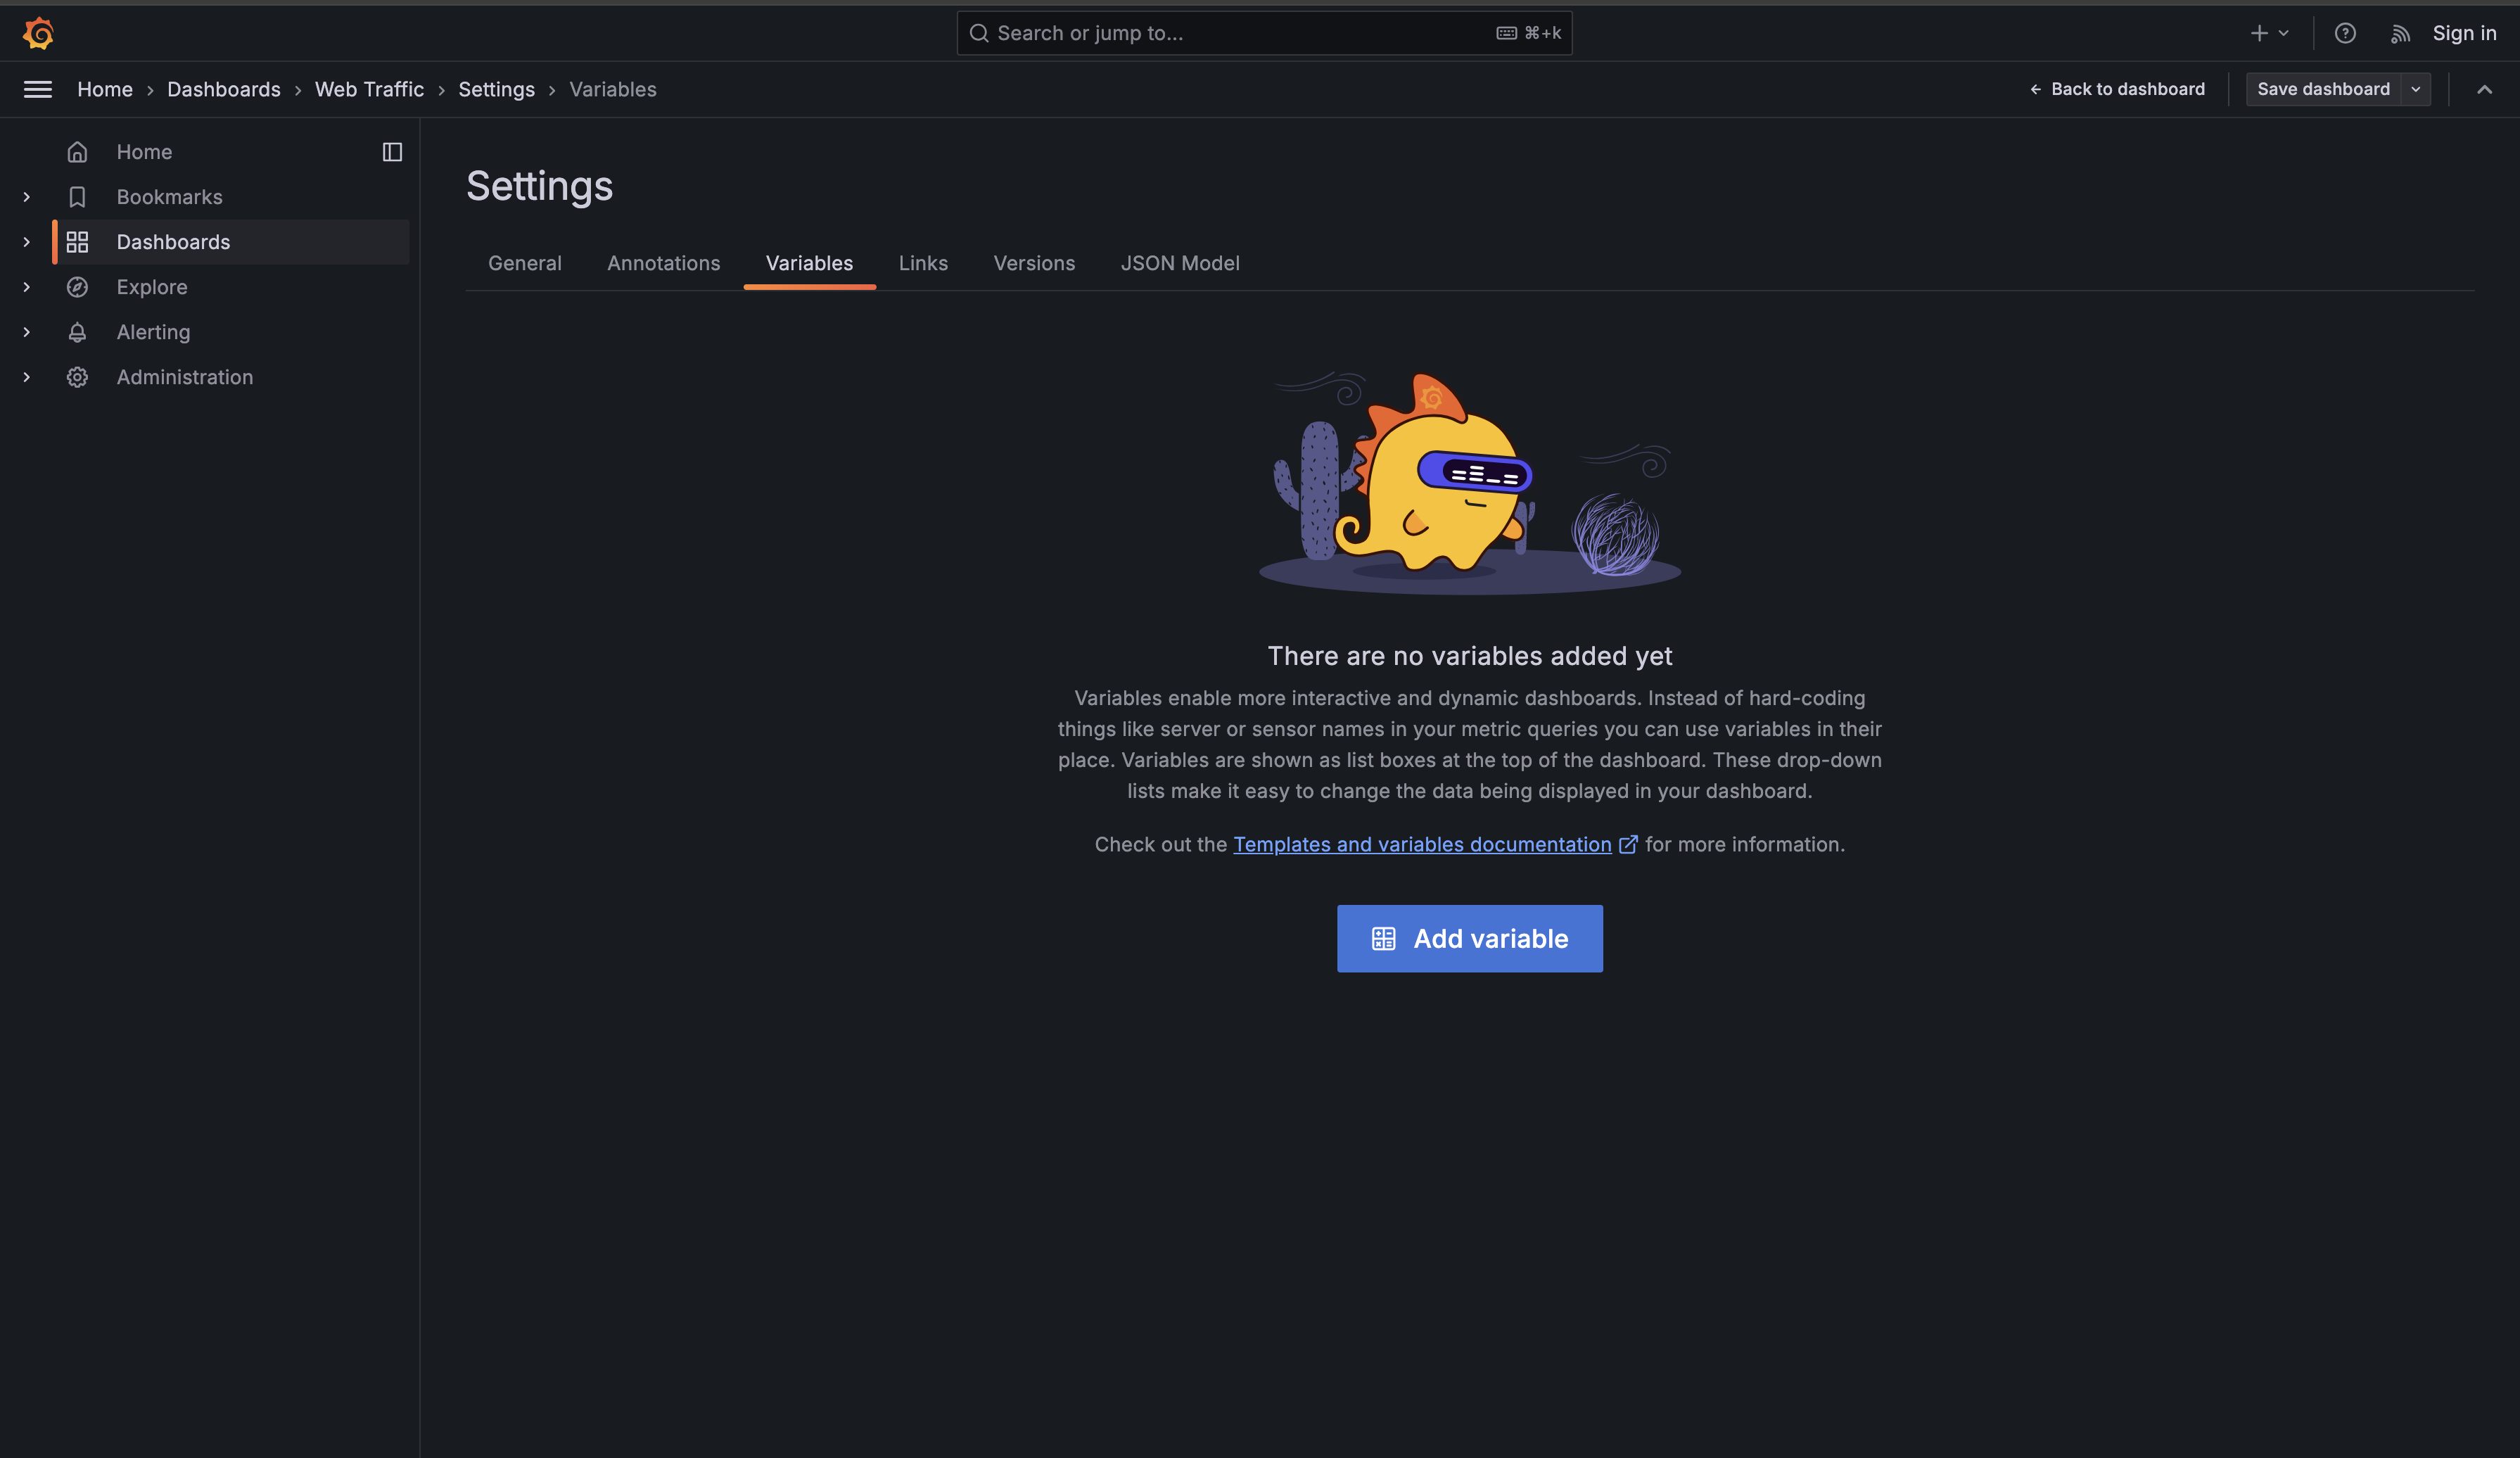
From the settings menu, select Variables, then click the Add variable button. You'll see a form with several configuration options. Here's how to fill them out:
General Section:
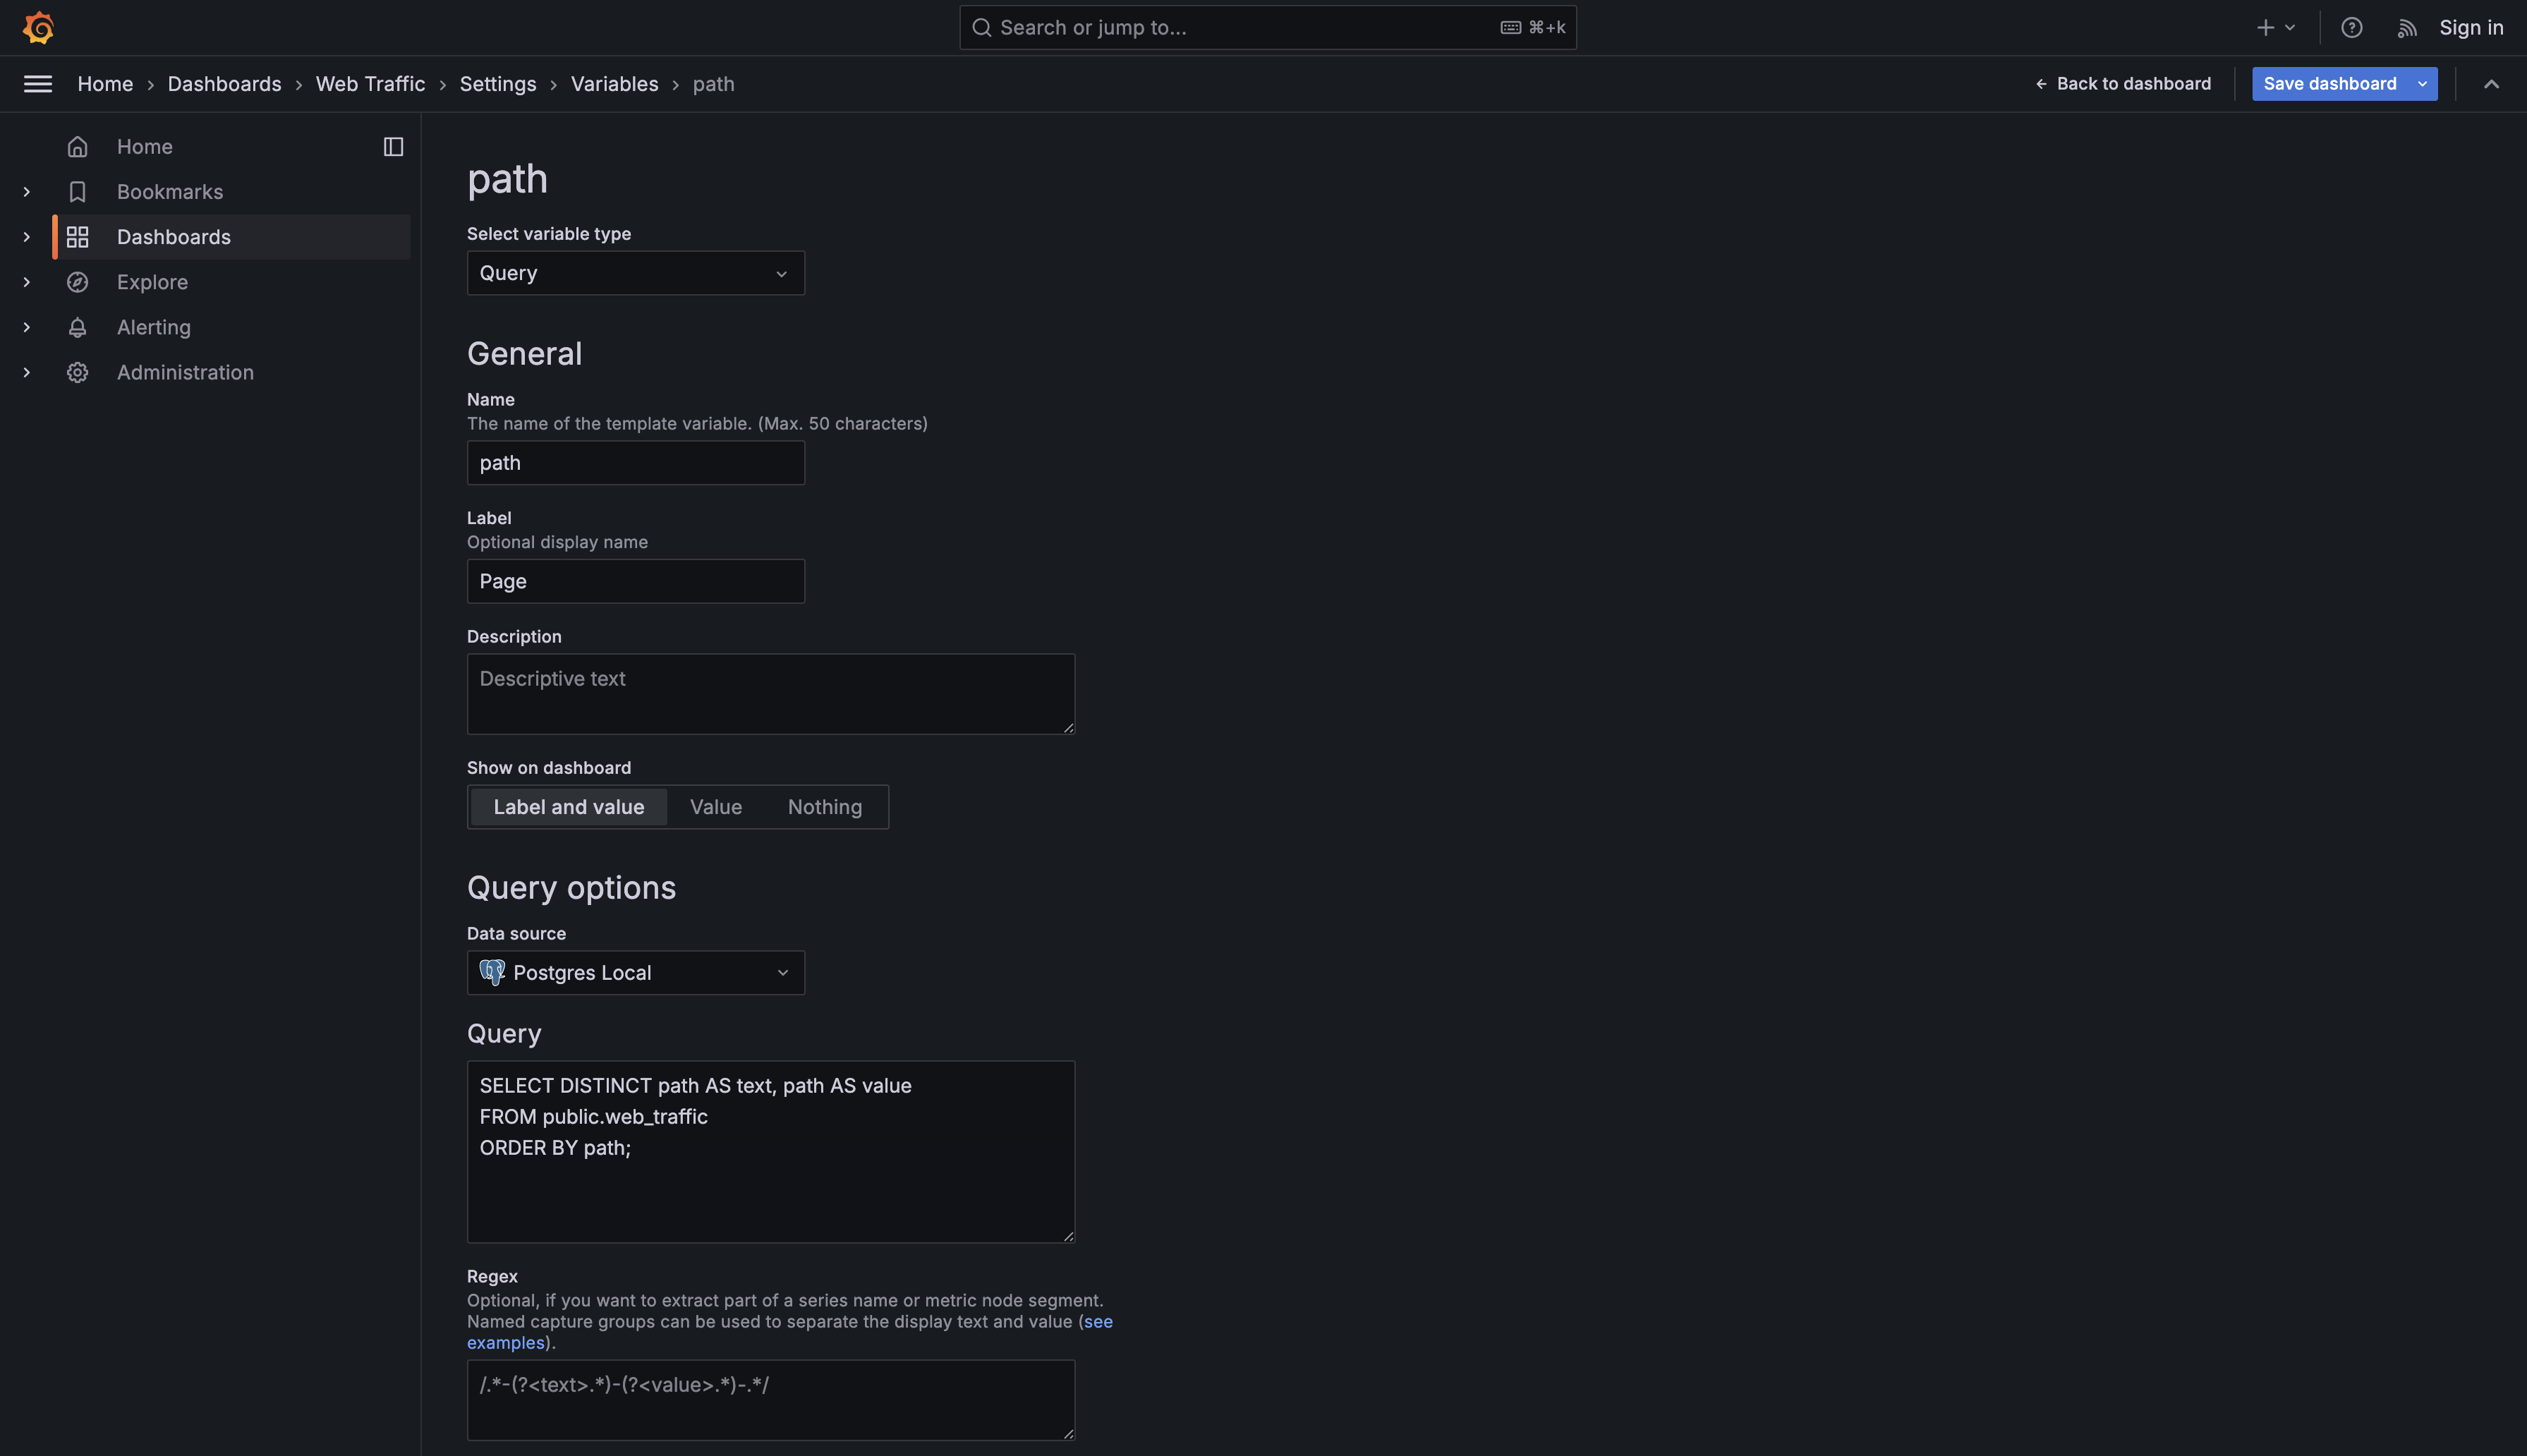
- Type: Select Query from the dropdown. This tells Grafana to populate the variable options by running a database query.
- Name: Enter
path. This is the internal name you'll use to reference this variable in your queries. Variable names should be lowercase and contain no spaces. - Label: Enter
Page. This optional field determines what users see above the dropdown. If you leave it blank, Grafana will use the variable name instead.
Query Options Section:
- Data source: Select your PostgreSQL data source (it might be named "Postgres Local" or similar).
- Query: This is where you'll write the SQL query that retrieves the list of pages. Enter the following:
Let's break down what this query does. The SELECT DISTINCT path part retrieves all unique page paths from your web_traffic table, eliminating any duplicates. If a page has received thousands of hits over time, it will only appear once in the results. This ensures your dropdown doesn't show the same page multiple times.
The AS text, path AS value portion follows a specific pattern that Grafana requires for query variables. Grafana expects these two columns with these exact names: text and value. The text column determines what users see displayed in the dropdown menu. The column determines what gets substituted into your panel queries when that option is selected. In this case, we're using for both, which means if your database contains a path like "/products," users will see "/products" in the dropdown, and that exact string will be used to filter your queries.
After filling out these fields, click the Save dashboard icon in the top right corner—your variable won't persist until you do this.
Before we connect this variable to your panels, it's crucial to understand the difference between two types of queries in Grafana: variable queries and panel queries. This distinction causes confusion for many beginners, but once you understand it, everything clicks into place.
The variable query you just wrote serves one purpose: to populate the dropdown menu with options. This query runs once when the dashboard loads (or when you manually refresh variables) and returns a list of text values. Look at the query again:
This query returns results that look like this:
Notice that this result set contains only text columns. There are no timestamps, no numeric values—just the list of page paths. Grafana takes these results and converts them into dropdown options. The text column becomes what users see, and the value column becomes what gets substituted into your queries. This query never displays data in a panel; it only populates the variable selector.
Panel queries work completely differently. Every panel on your dashboard runs its own query to fetch data for visualization. These queries must return data in a format that matches the panel type. For a time series visualization, Grafana requires:
- A time column (timestamps)
- One or more value columns (numeric data to plot)
If your panel query returns only text, or is missing the time column, Grafana will display an error like "Data is missing a number field" or "No time field found." This is the most common mistake when first using variables: putting the variable query in a panel instead of creating a separate panel query that uses the variable.
Here's what your panel query should look like:
Now comes the powerful part: replacing the hard-coded path value with a reference to your variable. When you reference a variable in a query, you use the syntax ${variable_name}. For our page variable, that means using ${path}.
Note: Grafana also supports a shorthand syntax without braces: $variable_name. Both ${path} and $path work identically. The braces are only required when you need to concatenate text directly after the variable (like ${path}_suffix), but many users prefer the braces for clarity. You'll see both forms in Grafana dashboards, and they're completely interchangeable for simple variable references.
However, there's one critical detail to remember: string values must be wrapped in single quotes. Since the path column contains text values (like "/", "/login", "/products"), your SQL query needs to treat them as strings. Here's the correct syntax:
The '${path}' syntax tells SQL that this is a text comparison. When you select "/" from the dropdown, Grafana substitutes the value, and your query becomes:
When you select "/products", it becomes:
Without the single quotes—if you wrote WHERE path = ${path}—Grafana would substitute the value without quotes, resulting in invalid SQL like , which would cause an error because the forward slash isn't a valid identifier.
Return to your dashboard view. Now when you select a different page from the dropdown, watch what happens: the panel immediately re-queries your database and displays data for the newly selected page, within the time range set by the dashboard's time picker. Every panel on your dashboard that uses the ${path} variable will update simultaneously, all showing data filtered by your current selection.
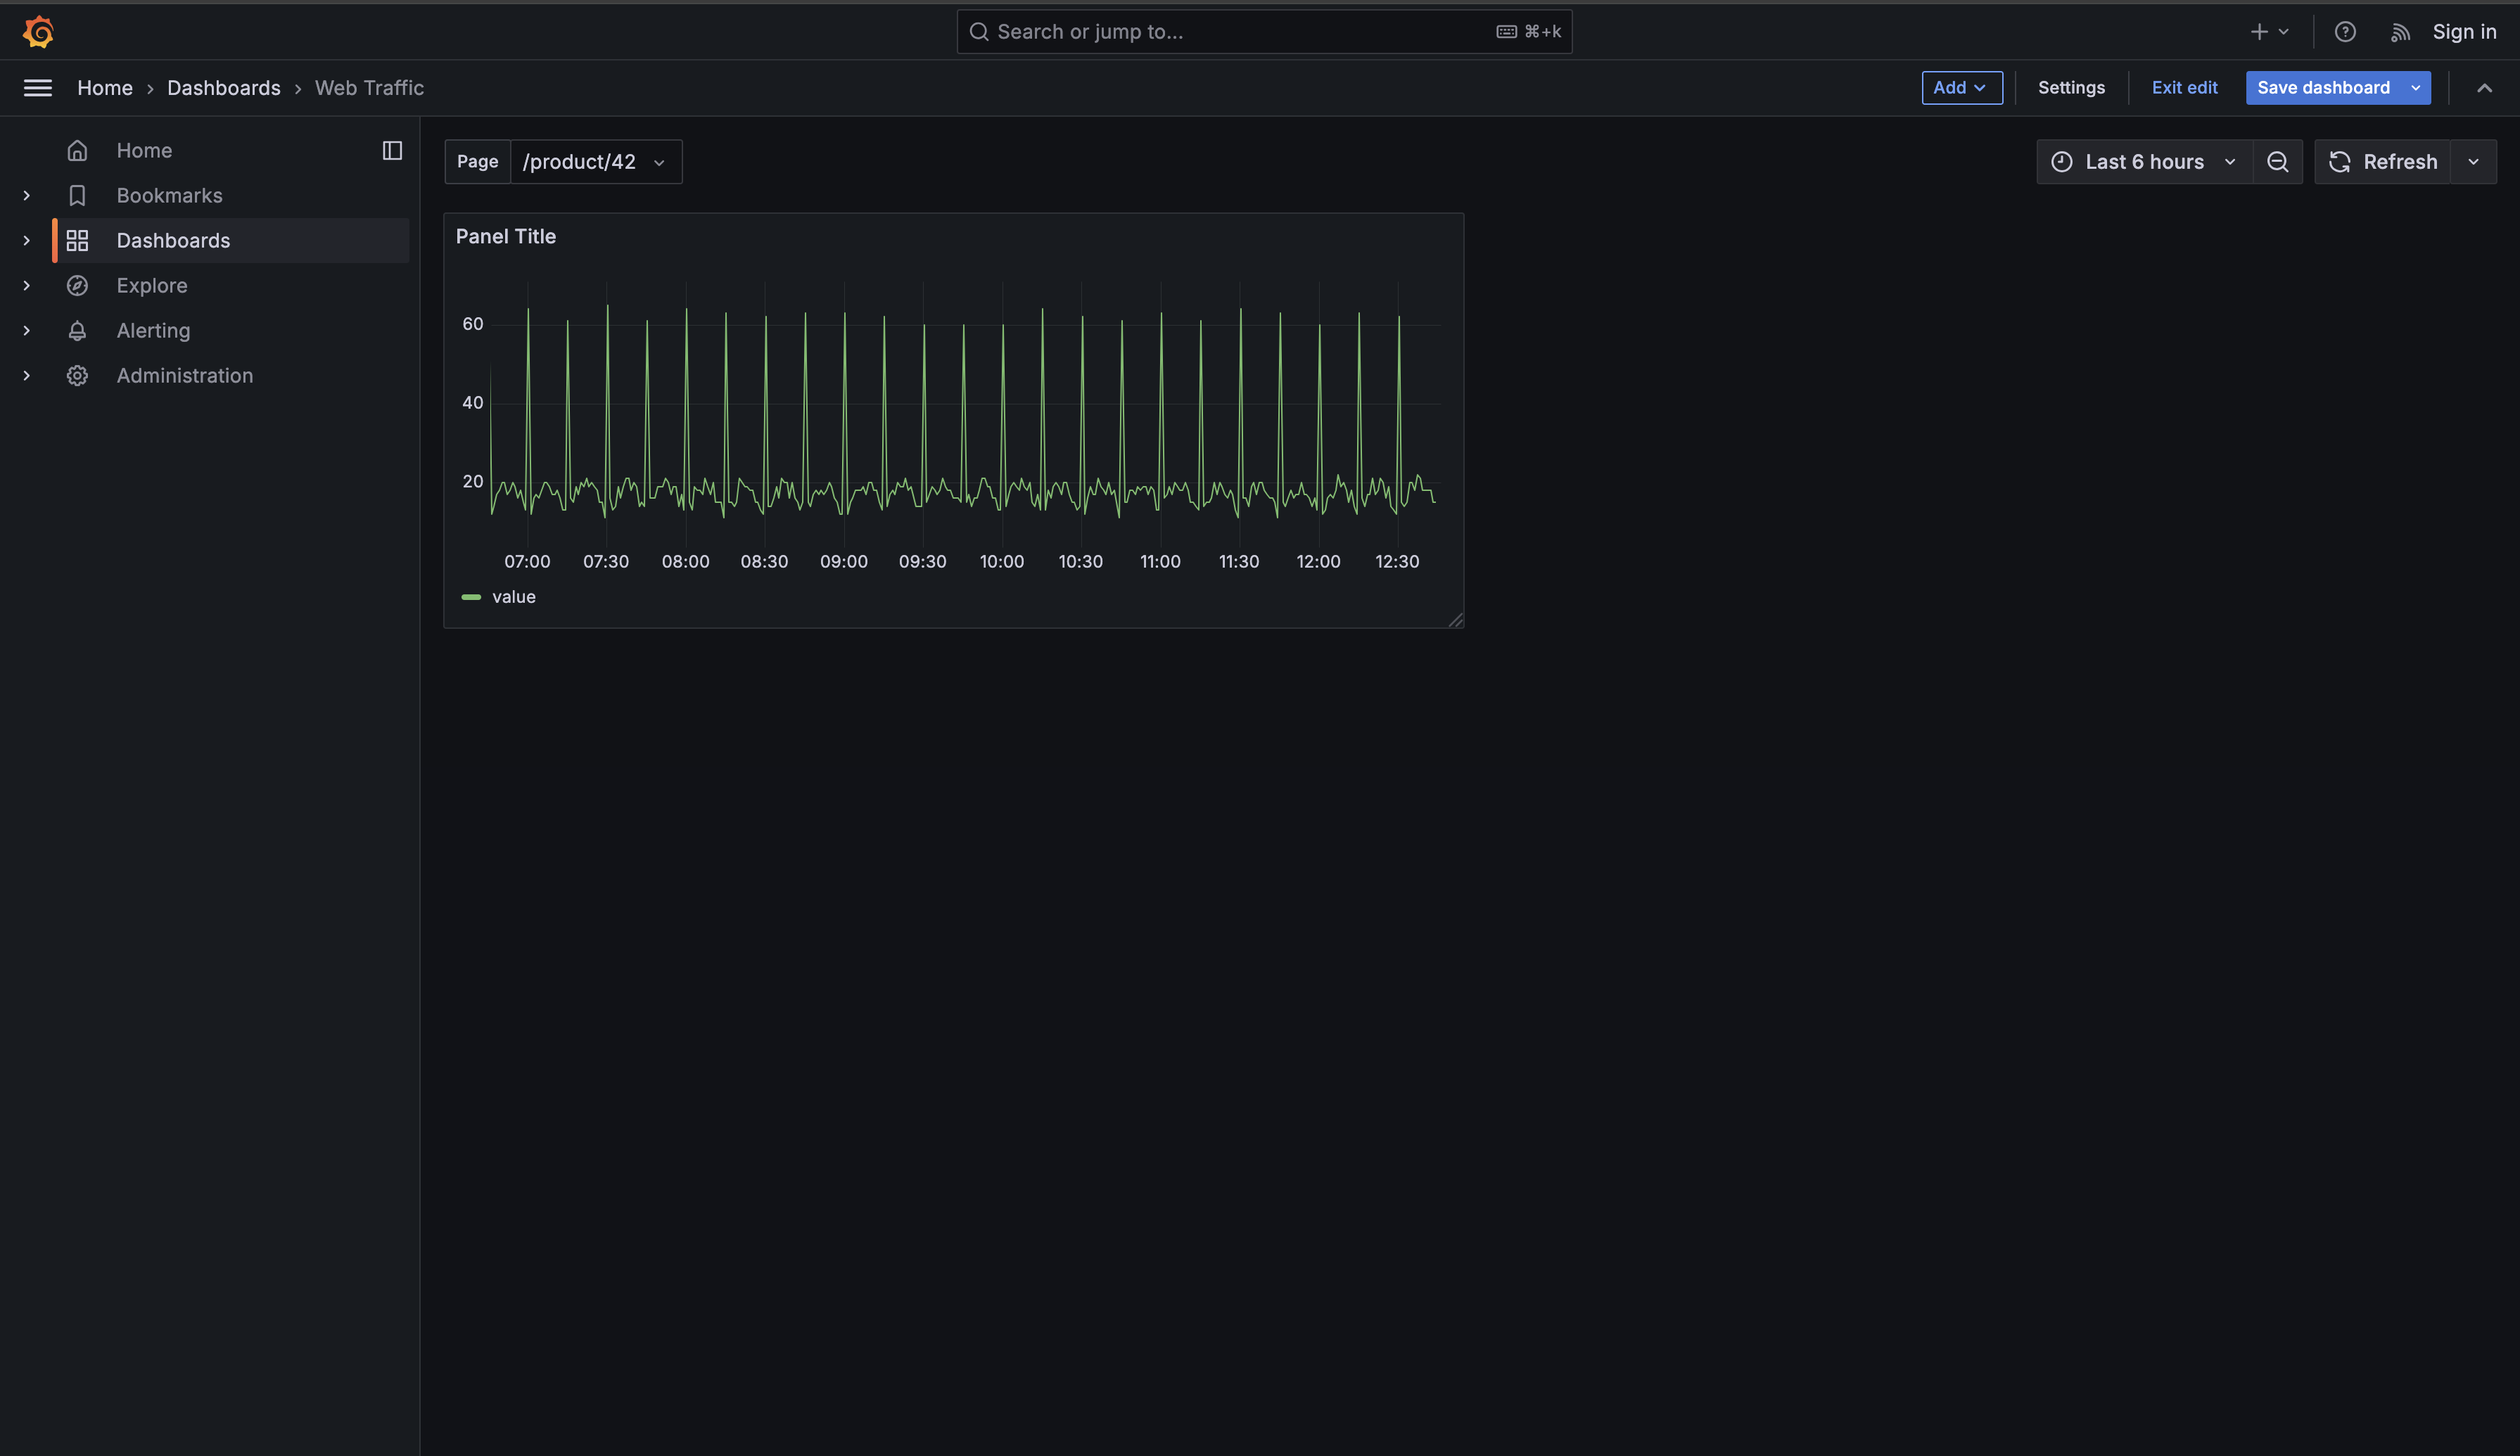
This is the magic of query variables. You've taken a static panel that could only show one page at a time and transformed it into a dynamic panel that can show any page with a single click. The query itself remains unchanged—only the substituted value changes based on the dropdown selection.
You've now learned how to create query variables in Grafana and use them in your panel queries. The process involves two distinct steps: first, creating a variable with a query that returns text and value columns to populate a dropdown menu; second, referencing that variable in panel queries using the ${variable_name} syntax.
The key concepts to remember are:
-
Variable queries return text values to populate dropdown menus. They use
SELECT DISTINCT field AS text, field AS valueto create the list of options. -
Panel queries return time series or other data for visualization. They must include appropriate columns for the panel type (time and numeric values for time series charts).
-
Variable references use
${variable_name}syntax, and text values must be wrapped in single quotes:WHERE field = '${variable_name}'. -
The distinction between these query types is crucial. The variable query runs once to populate the selector; panel queries run every time the dashboard refreshes or a new variable value is selected.
In the practice exercises that follow, you'll create query variables for different scenarios. You might build a variable that lists all services in your infrastructure, all device IDs from IoT sensors, or all product categories from sales data. Each practice reinforces the same fundamental pattern while exposing you to different data structures and use cases. By the end of the practice section, you'll be comfortable creating query variables for any field in any data source, setting the foundation for building sophisticated interactive dashboards.