In the previous lesson, you created your first query variable — a host selector that filters all panels on your dashboard. This was a significant improvement over hard-coded queries because it allowed you to switch between different hosts (host-a, host-b, host-c) with a single dropdown selection. However, if you look closely at your metrics data, you'll notice that host filtering alone isn't always enough to create focused visualizations.
Consider your disk metrics table. Each host doesn't just have one disk — it has multiple mount points. host-a might have a root partition (/), a var directory (/var), and a data volume (/data). When you filter by $host, your disk usage panel shows all three mount points combined, making it difficult to focus on a specific partition. The same issue exists with network metrics: each host has multiple network interfaces like eth0 and eth1. Filtering by host alone shows traffic across all interfaces mixed together.
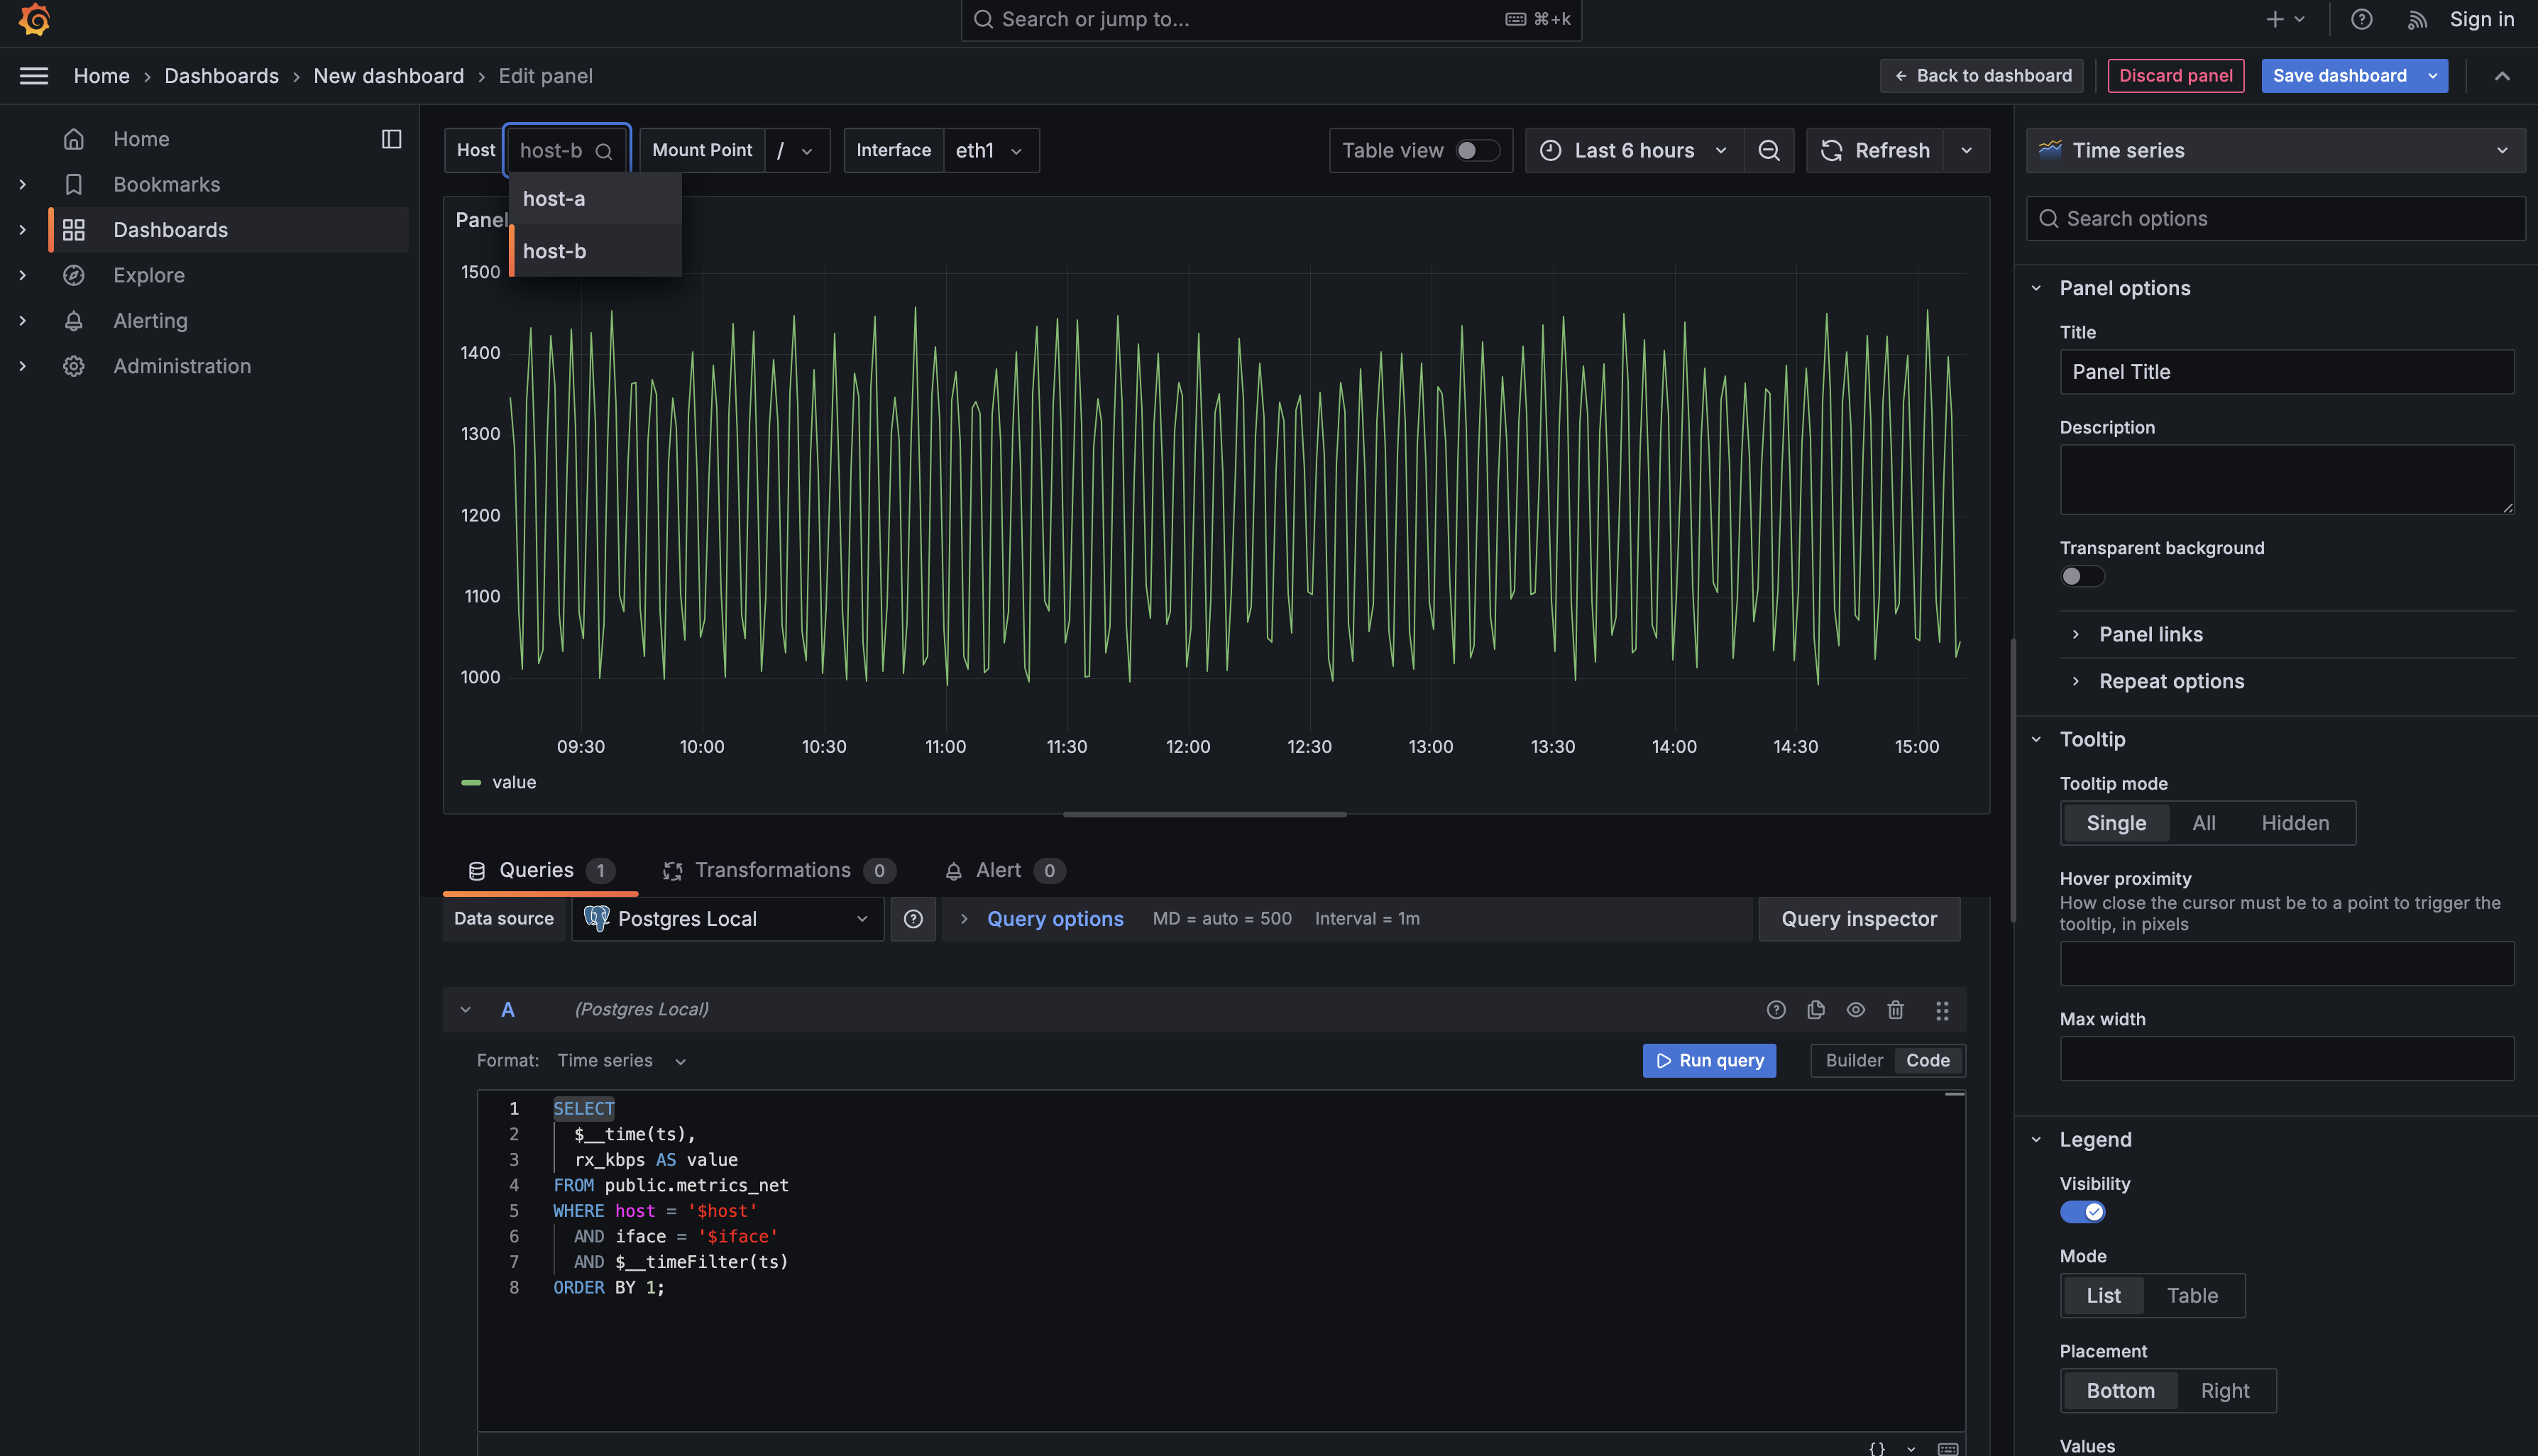
What you need is the ability to filter along multiple dimensions simultaneously. You want to say, "Show me disk usage for host-a's root partition," or "Show me network throughput for host-b's eth0 interface." This requires combining your existing host variable with new variables that capture these additional dimensions. In this lesson, you'll create two new variables — one for disk mount points and one for network interfaces — and learn how to use multiple variables together in your WHERE clauses.
Start by creating a variable that lists all available mount points from your disk metrics. This follows the exact same pattern you used when creating the host variable in the previous lesson: you’ll write a query that returns distinct mount points, and Grafana will use those results to populate a dropdown menu.
Open your dashboard settings by clicking the gear icon in the top right, select Variables from the sidebar, and click Add variable. Configure the variable with the following settings: Name: mount, Label: Mount Point, Type: Query, Data source: Postgres Local.
Then enter this query:
This query retrieves all unique mount points from your disk metrics table. The DISTINCT keyword ensures each mount point appears only once, even though it appears in hundreds or thousands of rows across different timestamps. The AS text, mount AS value pattern should be familiar from the previous lesson — this is the format Grafana requires for query variables. The text column determines what users see in the dropdown (like /, /var, /data), and the value column determines what gets substituted into your queries when that option is selected.
The ORDER BY mount clause sorts the mount points alphabetically. This is particularly useful for mount points because the forward slash character sorts before letters, which means your root partition (/) will always appear first in the list, followed by other paths like and .
Now create a similar variable for network interfaces. Add another variable with the name iface and label "Interface", and use this query:
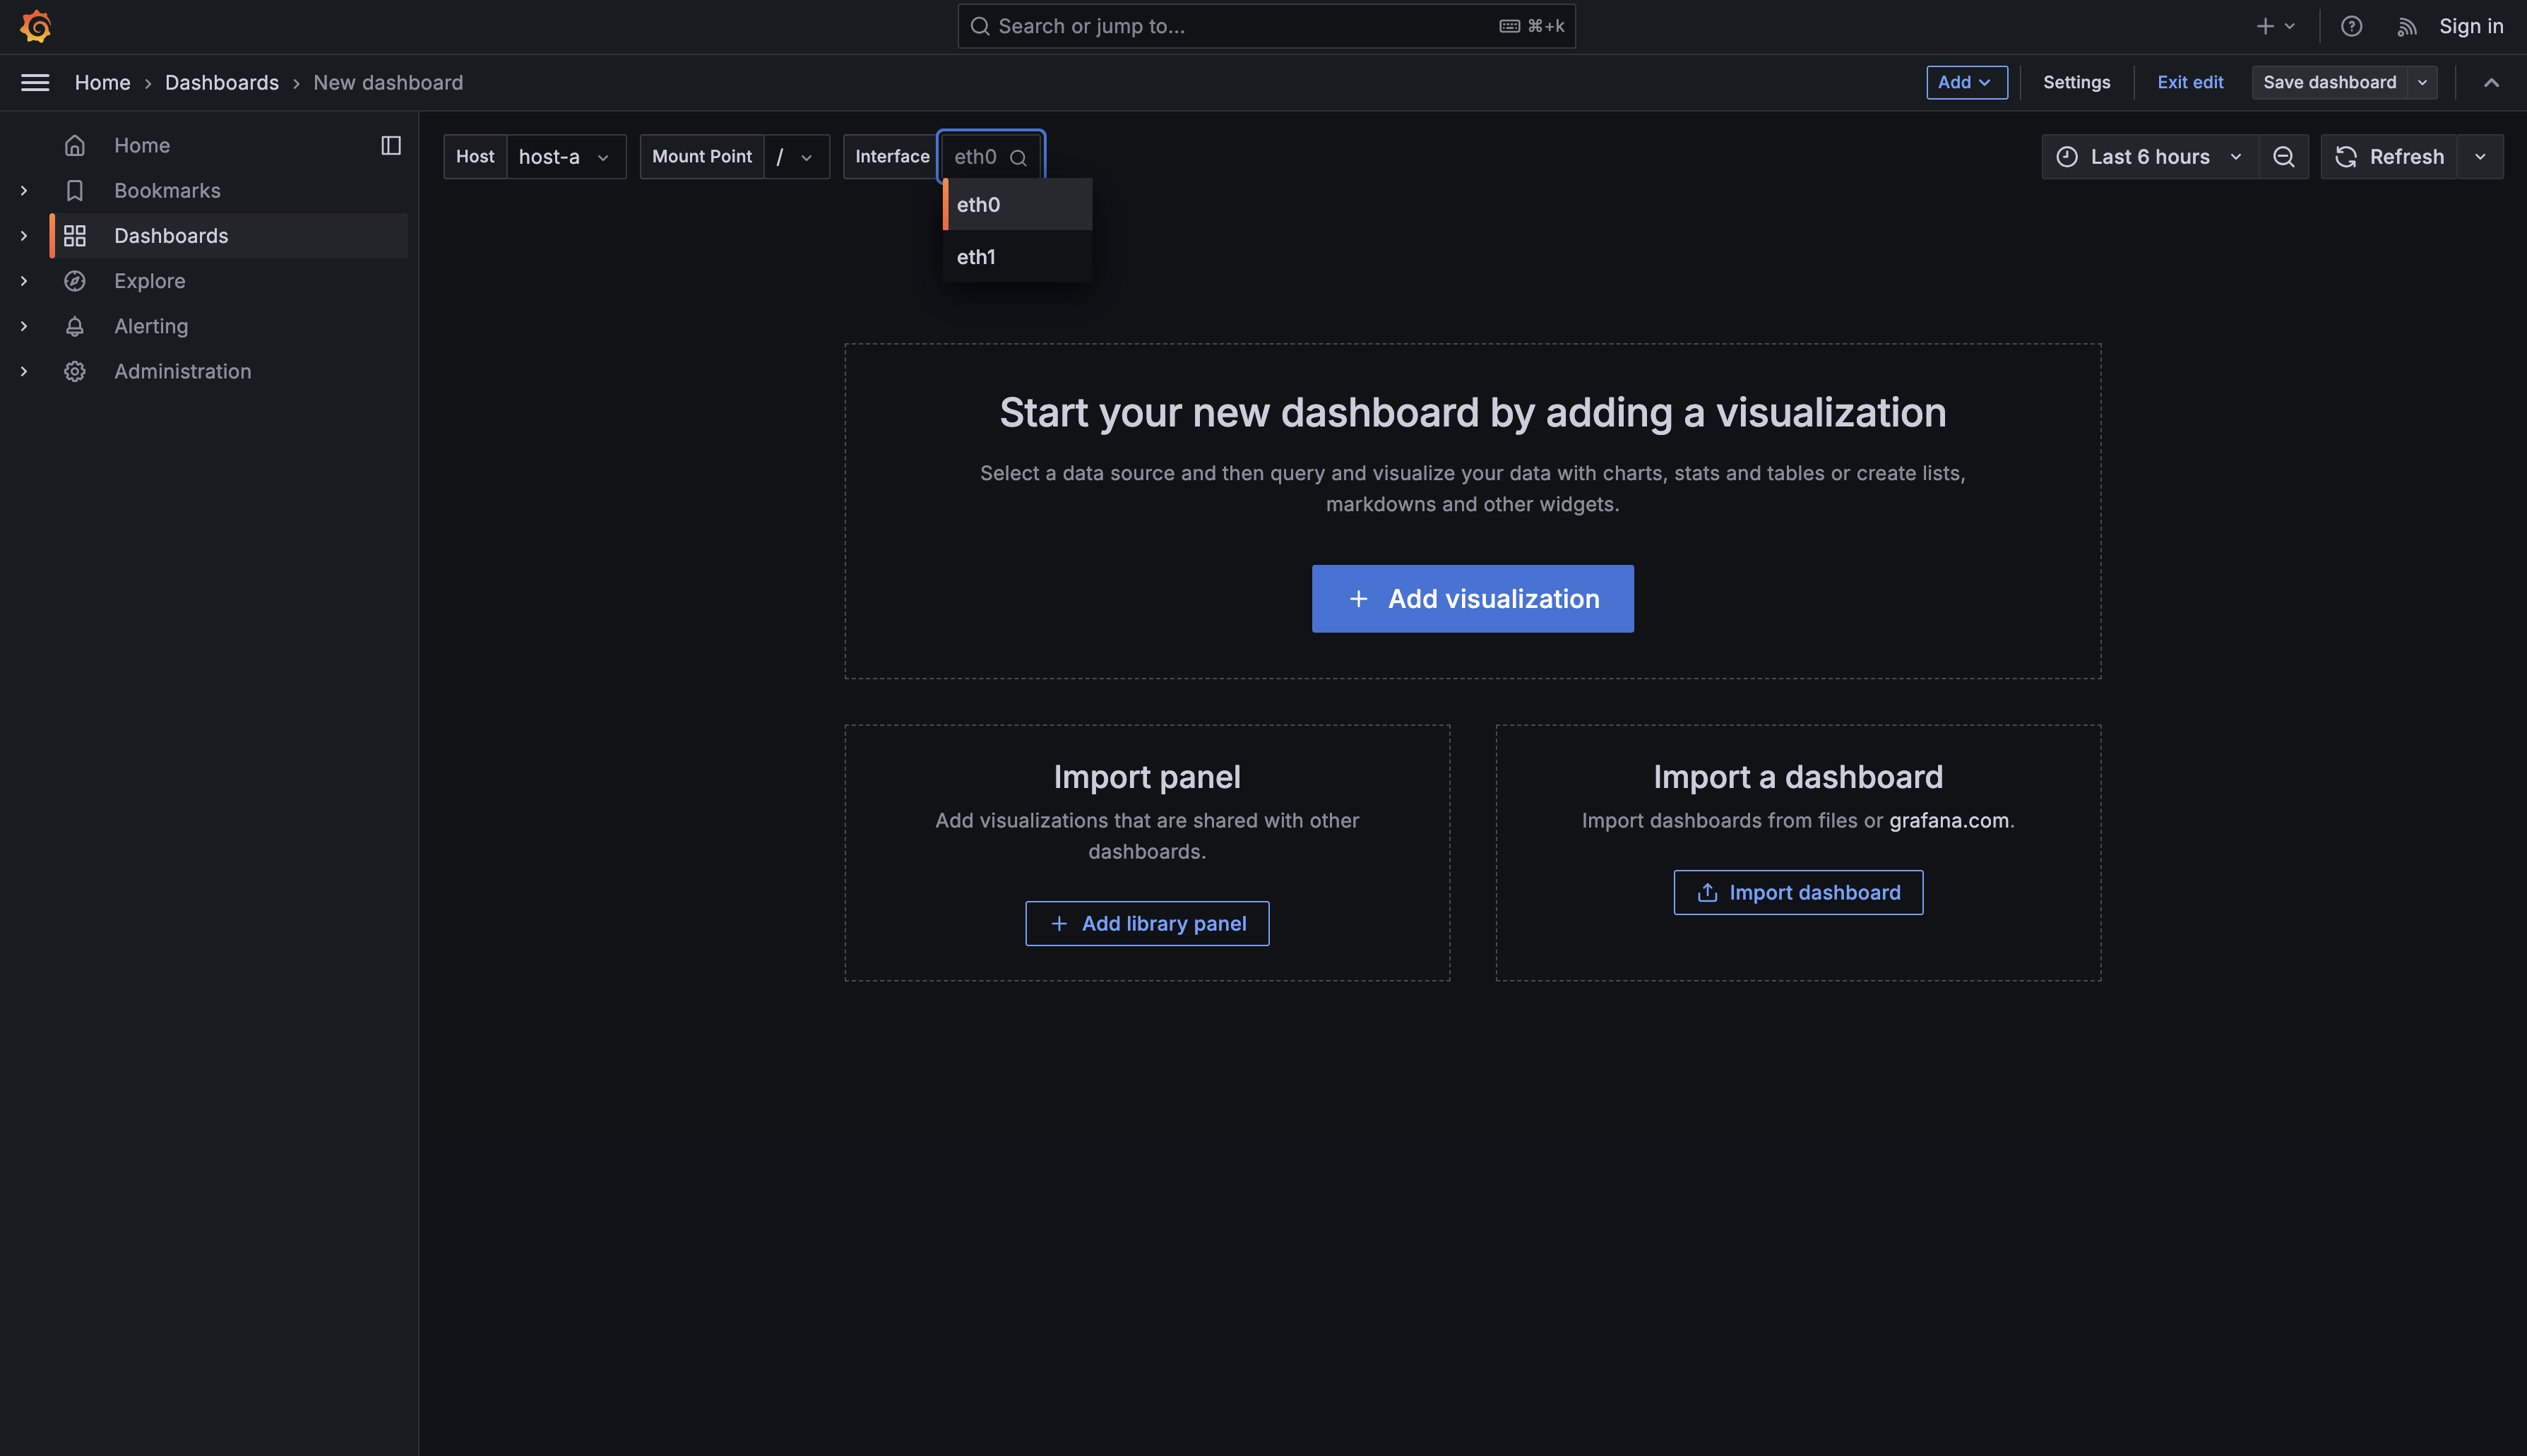
This query follows the identical pattern but queries the network metrics table instead. Network interfaces typically have names like eth0, eth1. The query retrieves each unique interface name and presents them as dropdown options.
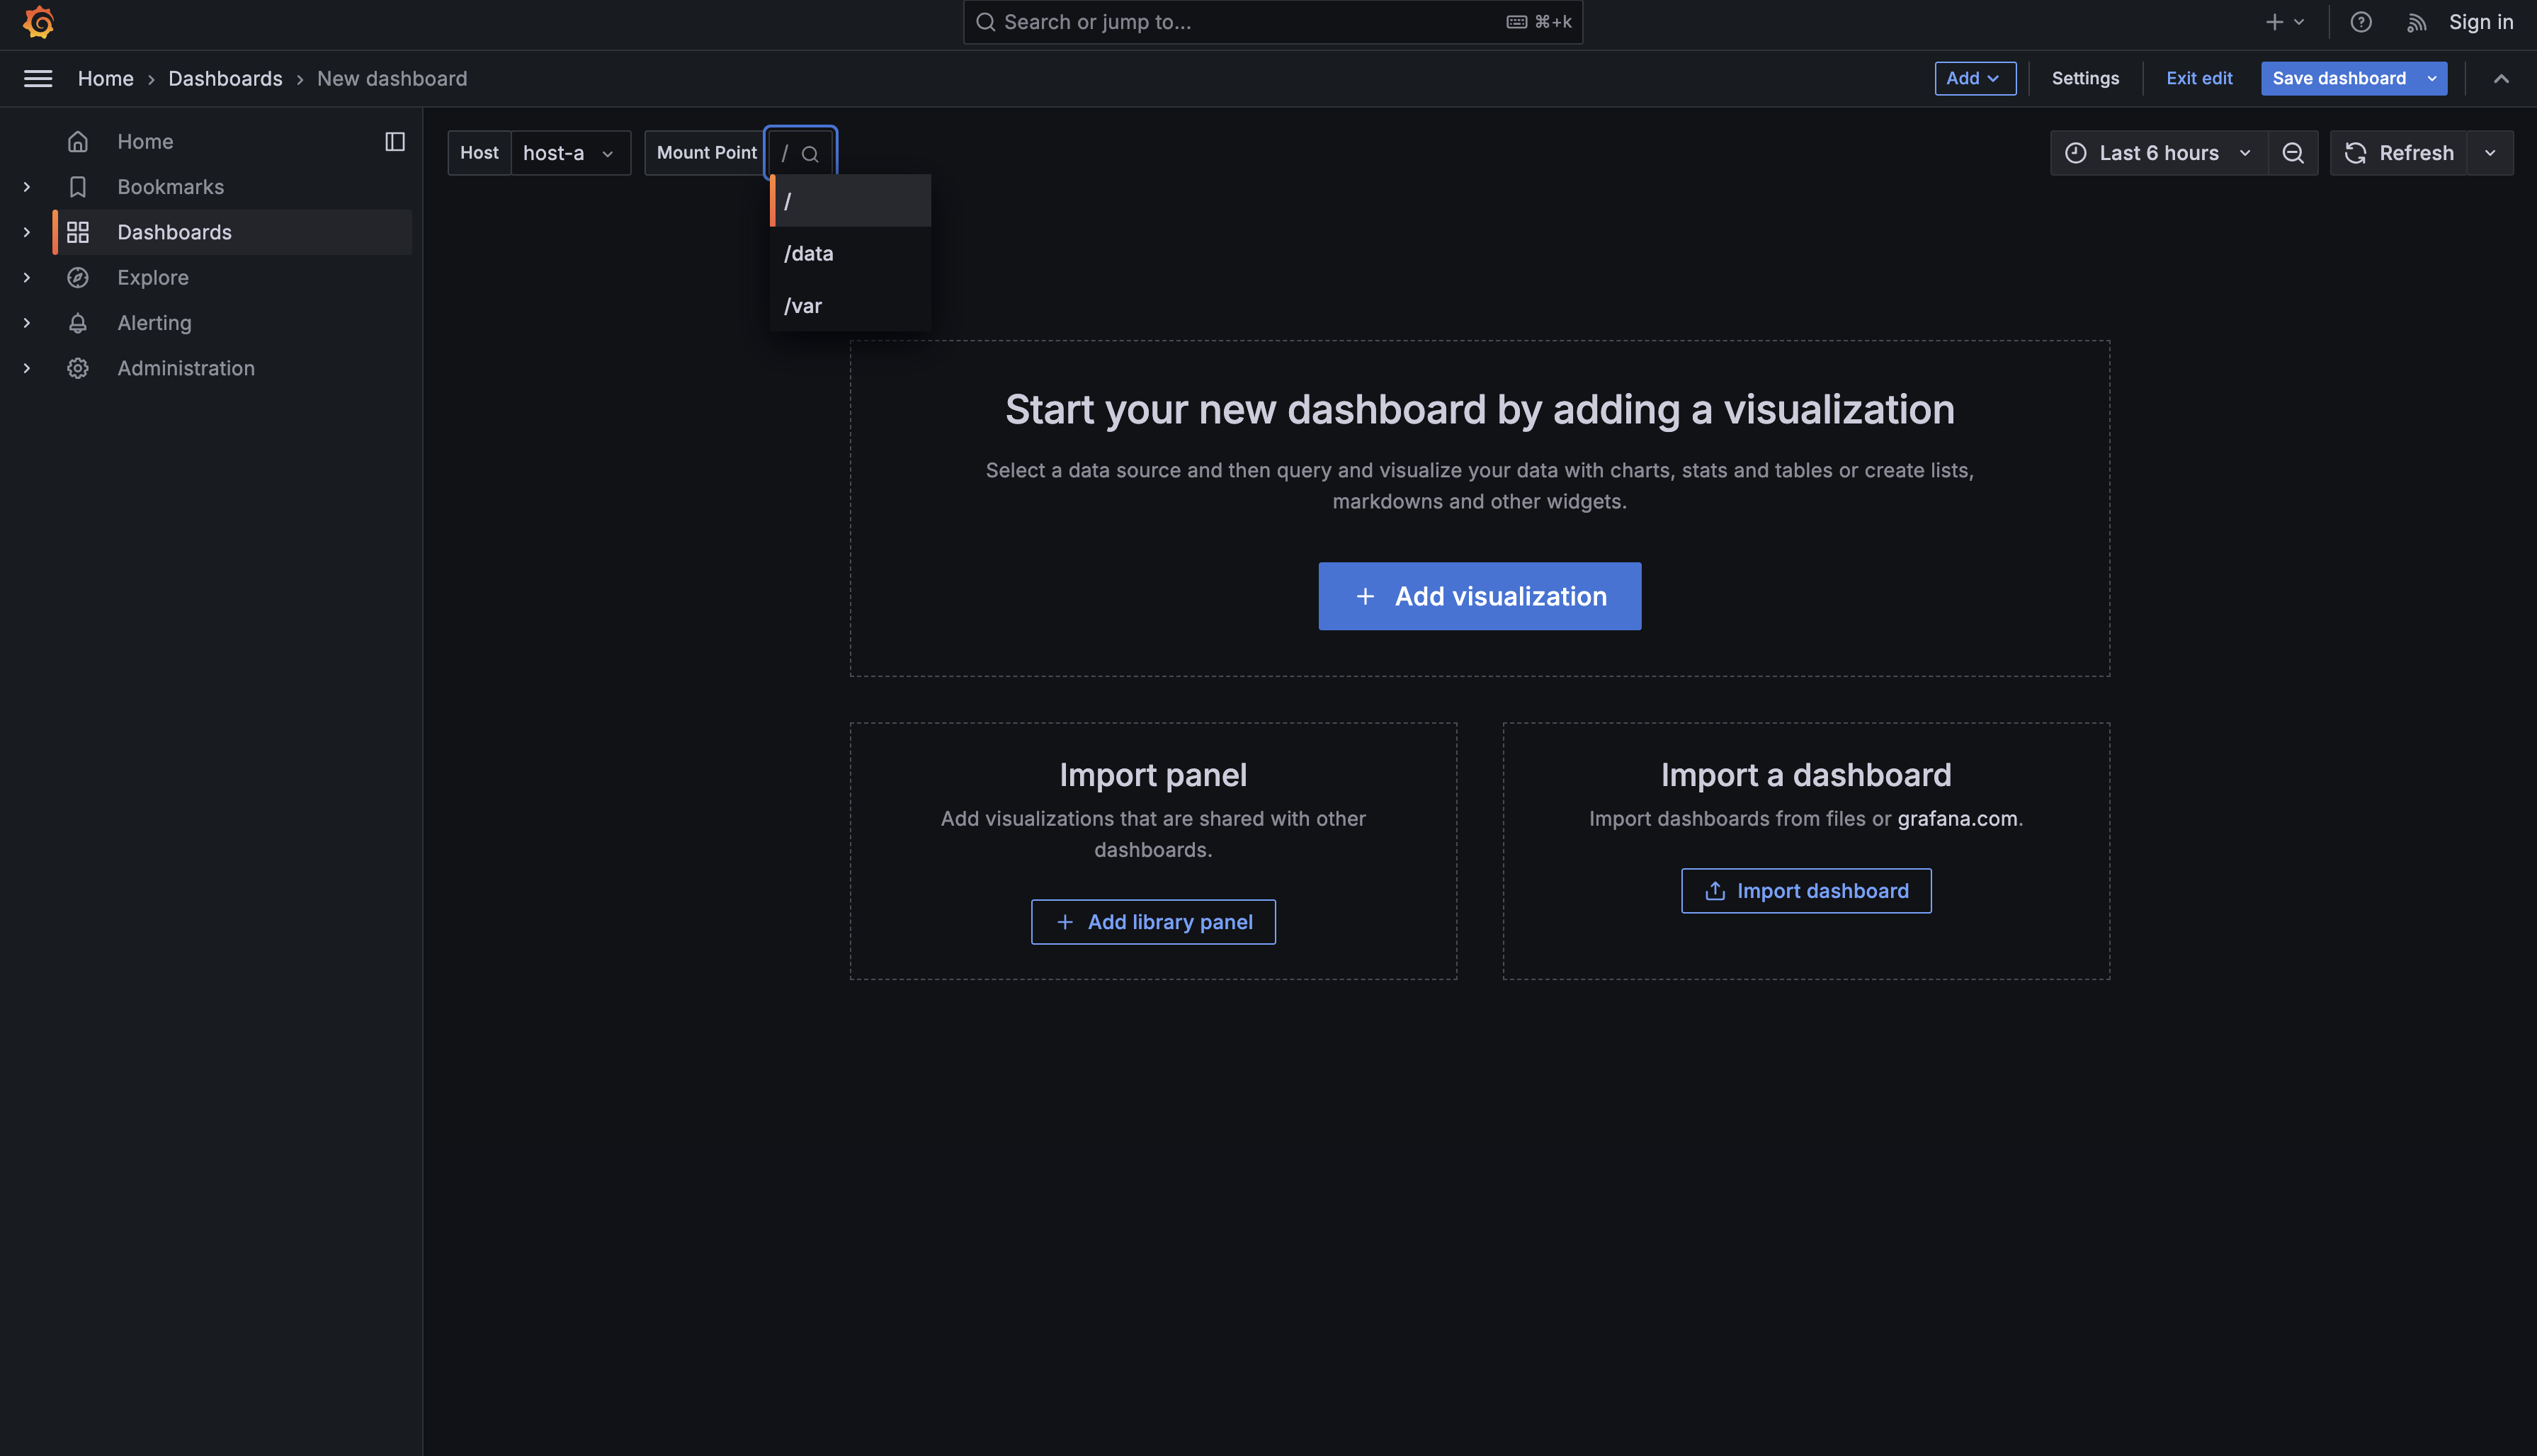
After creating both variables, save your dashboard. You should now see three dropdown menus at the top of your dashboard: Host, Mount Point, and Interface. These dropdowns work independently — you can select any combination of host, mount point, and interface. The next step is connecting these variables to your panel queries so they actually filter your data.
The power of multi-dimensional filtering comes from combining multiple variables in a single WHERE clause using the AND operator. When you write WHERE host = '$host' AND mount = '$mount', you're telling the database to return only rows that match both conditions simultaneously. This creates much more focused queries than filtering by host alone.
Here's a complete disk usage query that uses both the host and mount variables:
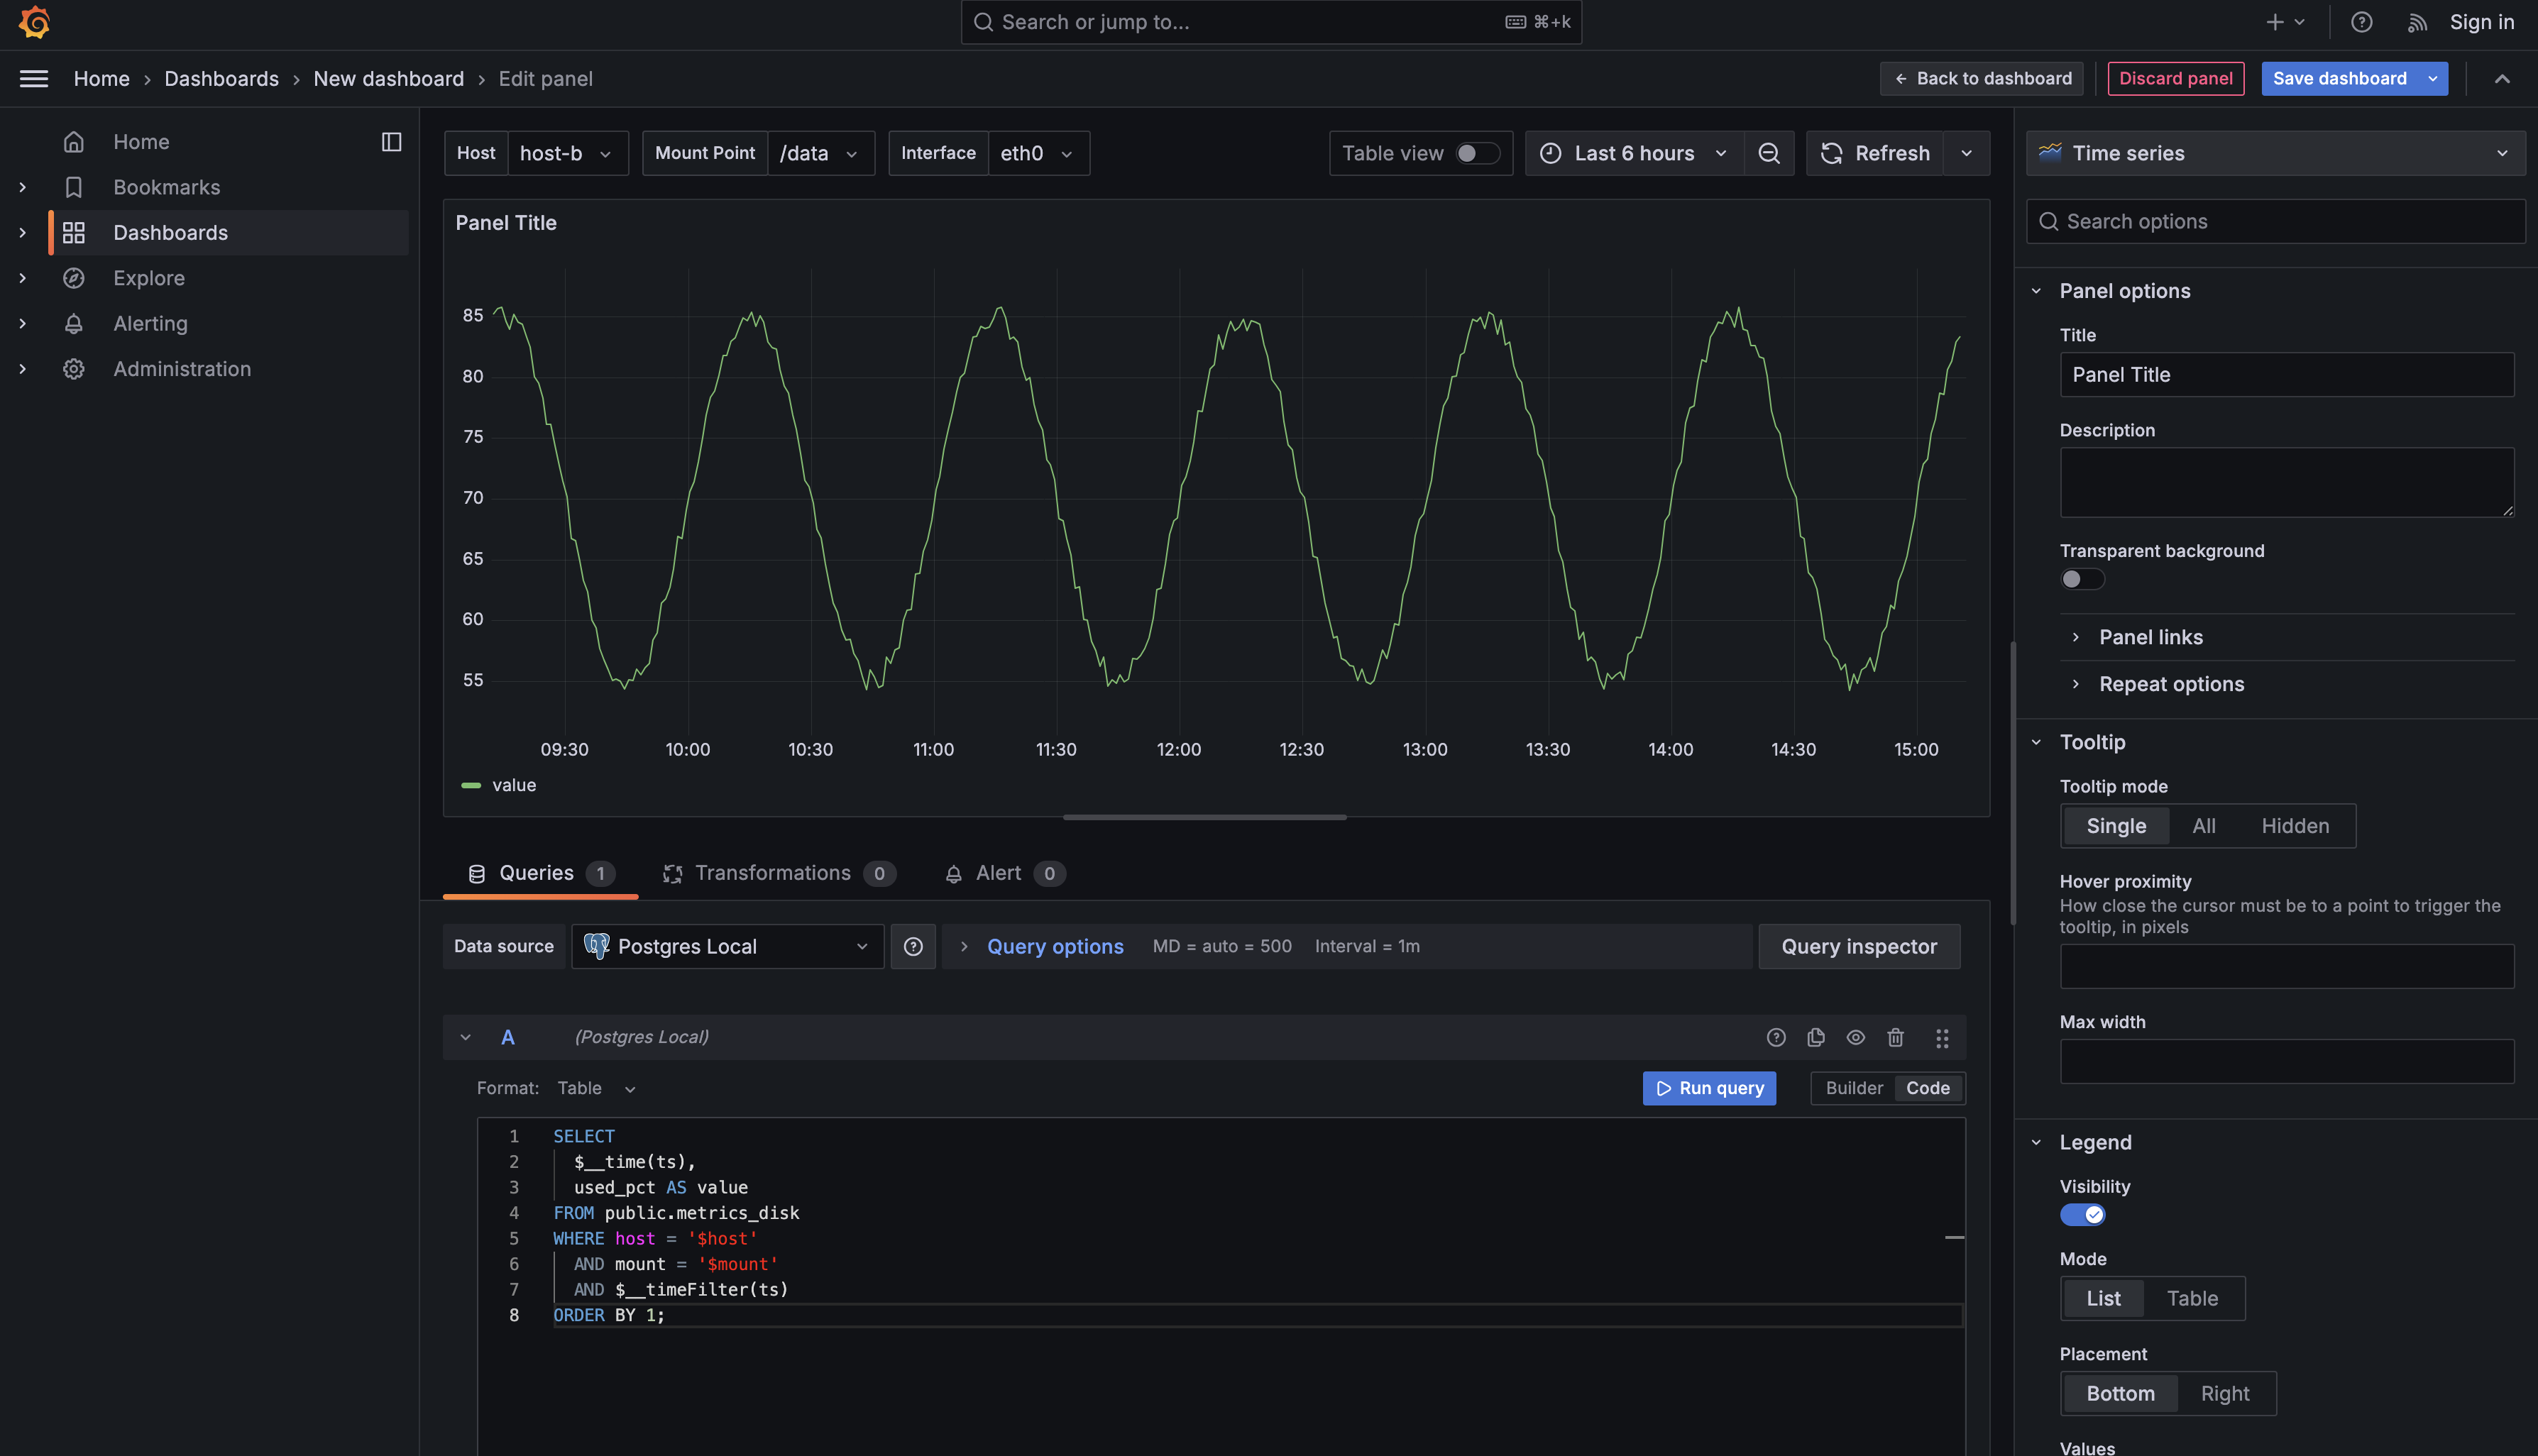
Notice how the WHERE clause now contains three conditions connected by AND. The first condition, host = '$host', filters rows to match the selected host from your host dropdown. The second condition, mount = '$mount', further narrows the results to match the selected mount point. The third condition, $__timeFilter(ts), applies Grafana's time range filter. All three conditions must be true for a row to appear in the results.
When you select host-a from the host dropdown and /data from the mount dropdown, Grafana substitutes these values, and your query effectively becomes:
This returns only disk usage data for the mount point on . Without the mount filter, you would see data for all mount points on mixed together. With both filters applied, you get a clean time series showing just the one partition you care about.
The same pattern applies to network metrics. Here's a complete network throughput query that uses both host and interface variables:
This query filters network receive throughput (rx_kbps) by both the selected host and the selected interface. When you choose host-b and eth0, the query returns only the receive throughput for eth0 on host-b. The AND operator ensures both conditions are applied simultaneously, giving you precise control over which data appears in your panels.
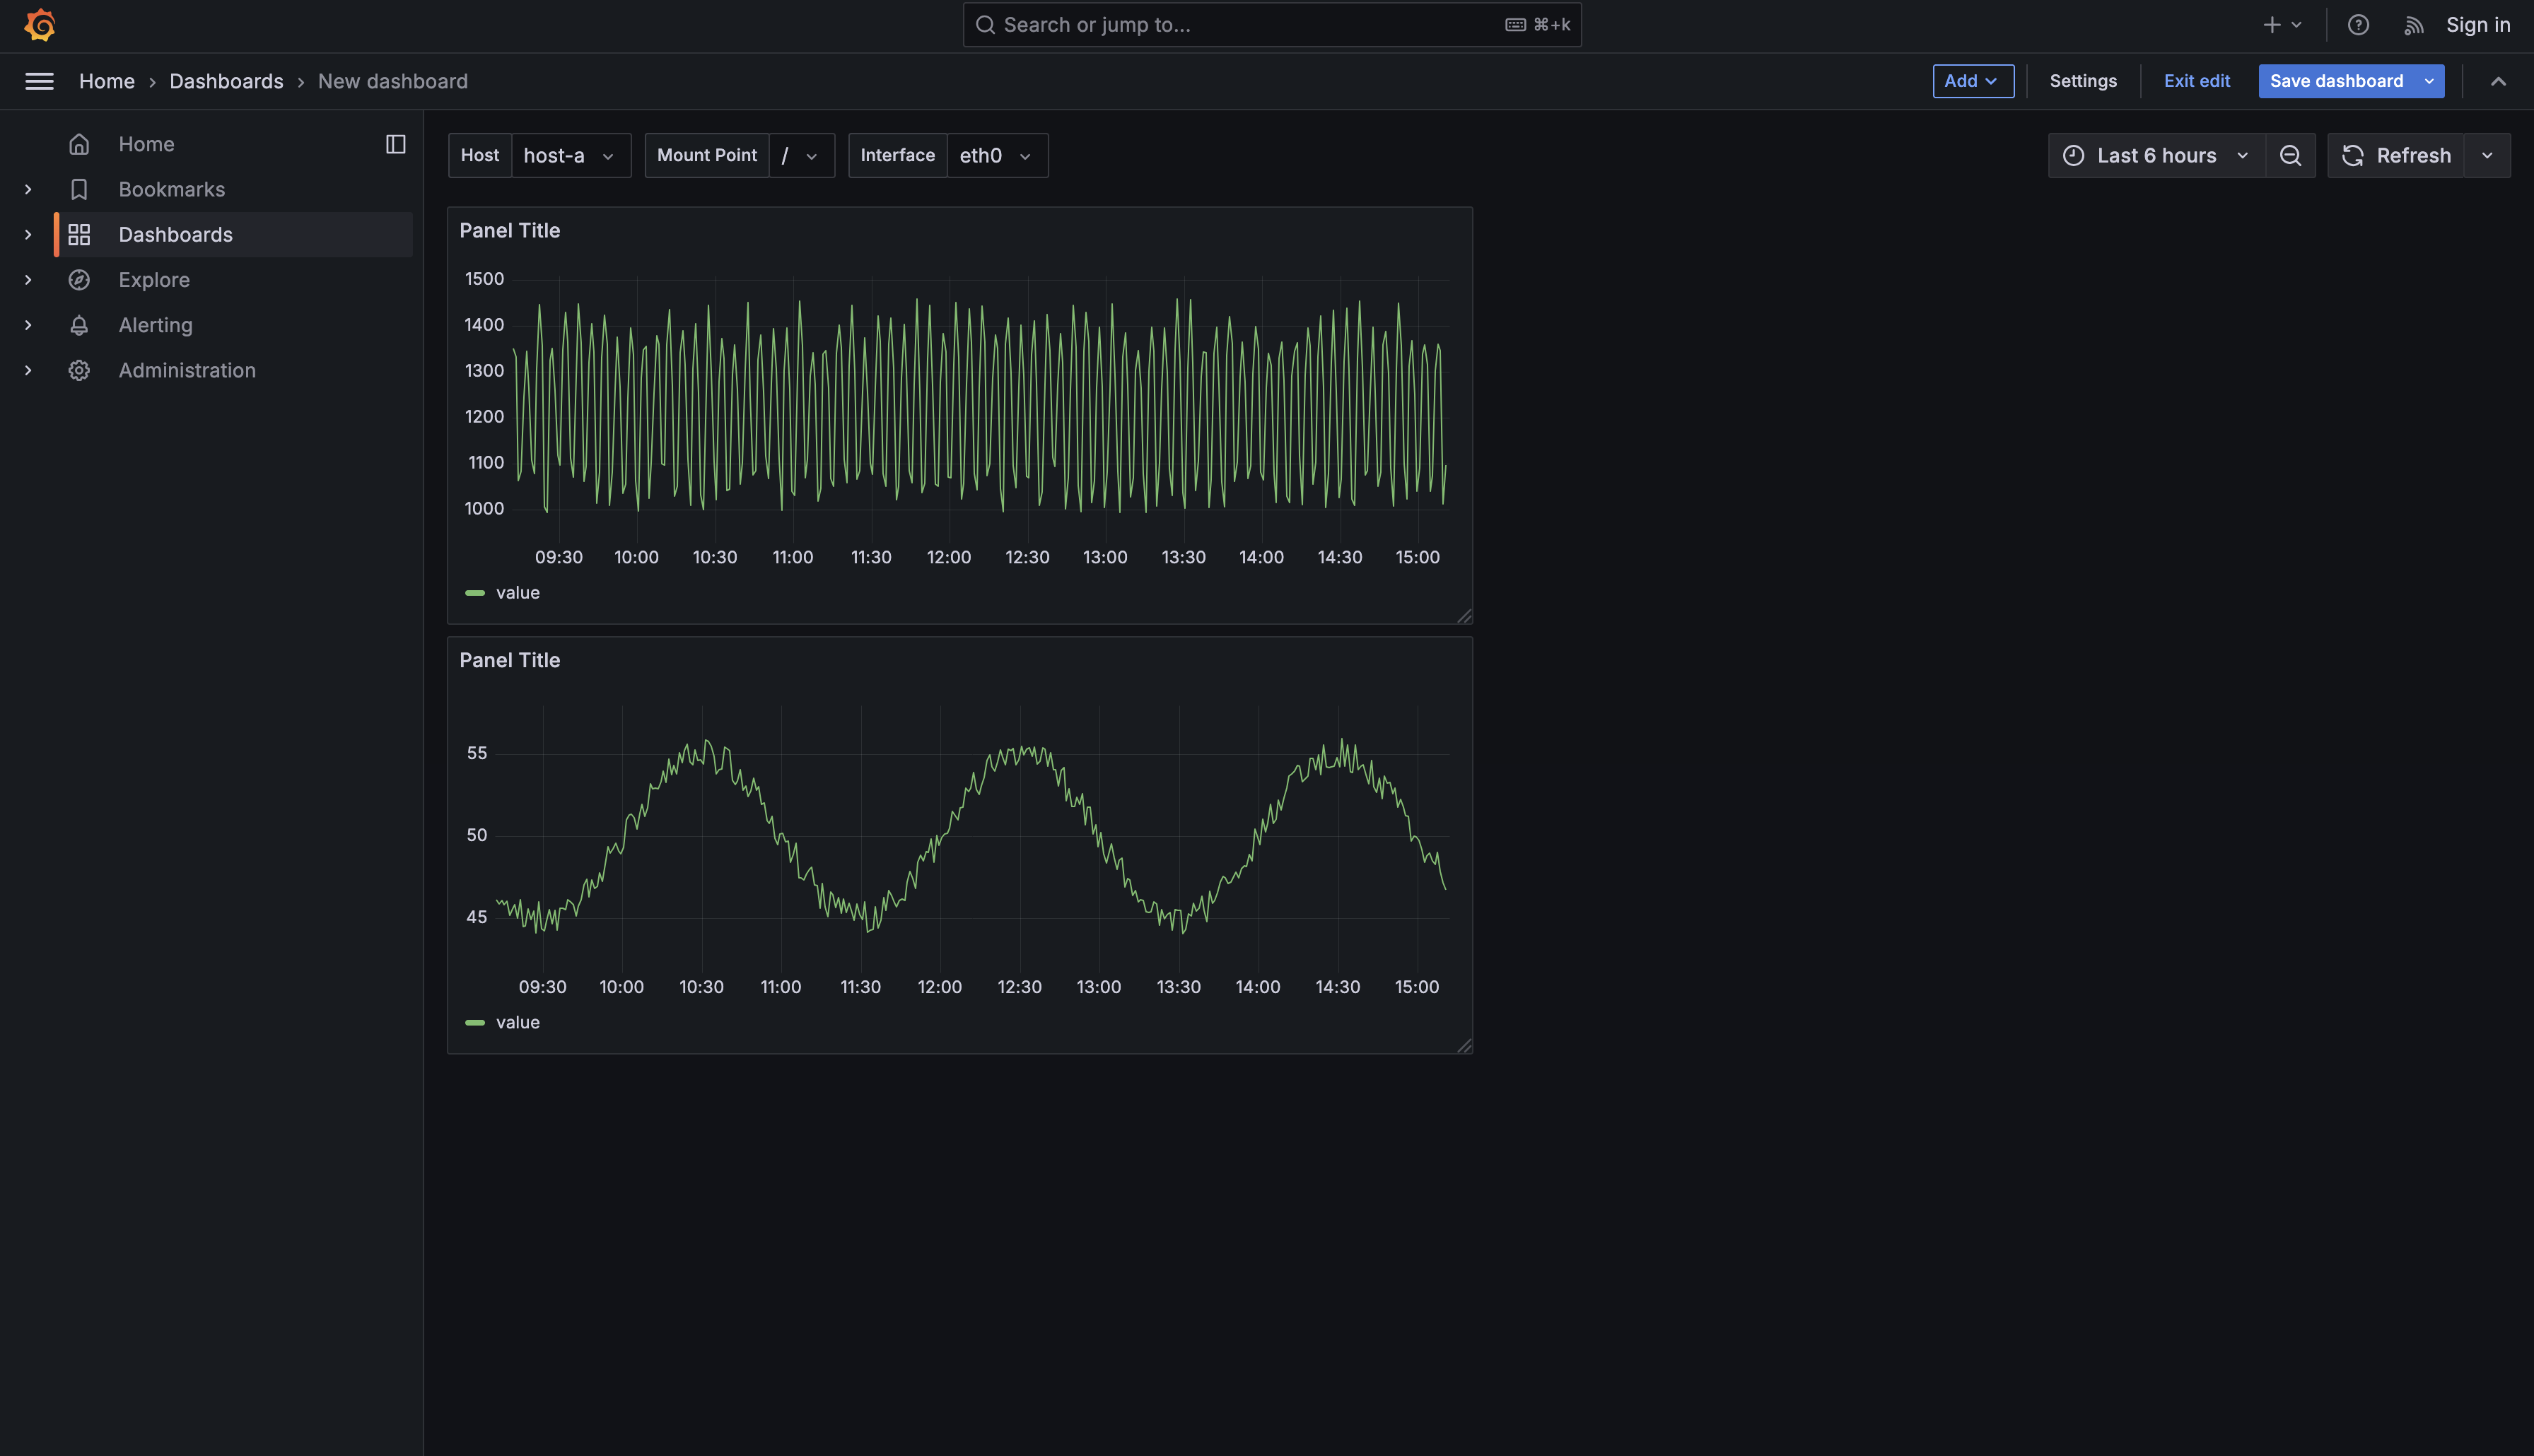
Now that you understand the query structure, let's see how these variables work together in practice. When you view your dashboard, you'll see three dropdowns at the top: Host, Mount Point, and Interface. These selectors are independent but work together when your panel queries reference multiple variables.
Suppose you create a disk usage panel using the query from the previous section. When you first load the dashboard, it might default to showing host-a, /, which displays disk usage for host-a's root partition. The panel shows a single time series line representing the used_pct values over time for that specific combination.
Now click the Mount Point dropdown and select /data instead. The moment you make this selection, the panel automatically re-queries the database. The query still filters by host-a (because that's still selected in the host dropdown), but now it's looking for rows where mount = '/data'. The visualization updates to show the disk usage of the data volume instead of the root partition. You've just switched from monitoring one partition to another without editing any queries or creating duplicate panels.
This is the power of multi-dimensional filtering. Your disk metrics table might contain thousands of rows covering three hosts, each with three mount points, recorded every minute over weeks of time. That's potentially over 100,000 rows of data. But with two dropdown selections — picking a host and a mount point — you can instantly zoom in on exactly the subset of data you need to see. Instead of looking at nine time series (three hosts times three mounts), you're looking at just one: the specific mount point on the specific host that matters to you right now.
The same interaction works for network panels. If you have a network throughput panel using the interface variable, selecting eth0 shows traffic for that interface, while selecting shows loopback traffic. Each dropdown selection applies an additional filter, narrowing the results further. You could have dozens of hosts with multiple interfaces each, but with just two clicks, you can focus on a single interface on a single host.
You've now learned how to extend your interactive dashboards beyond single-variable filtering by adding dimension-specific variables. The key insight is that variables work together through the AND operator in WHERE clauses, allowing you to filter data across multiple dimensions simultaneously.
The pattern you learned applies universally: create a variable query using SELECT DISTINCT field AS text, field AS value from the appropriate table, then reference that variable in your panel queries with the syntax '$variable_name' wrapped in single quotes for string values. When you combine multiple variables with AND in your WHERE clauses, each variable adds another layer of filtering, helping you create focused visualizations that show exactly the data you need.
In the practice exercises that follow, you'll create mount and interface variables yourself and write queries that combine them with the host variable. You'll practice the multi-dimensional filtering pattern on different metrics, reinforcing your understanding of how multiple variables work together. By the end of the practice section, you'll be comfortable building dashboards that filter data across any number of dimensions, whether it's hosts and mount points, services and regions, or any other combination your data provides. Get ready to put these concepts into action—up next, you'll dive into hands-on practices where you'll create and use multi-dimensional variables to build truly interactive dashboards!