Welcome back to Explain Unexpected Outcomes! Last time, you drew a clear line between theoretical probability and observed frequency, and you learned that a gap between the two is perfectly normal. Today you'll tackle the natural follow-up question: how large can that gap get, and what controls its size?
The short answer is sample size — the number of observations behind a result. A restaurant's perfect 5-star rating might come from just 4 reviews. A friend might visit a city once, get rained on, and declare the weather terrible. A manager might see two missed deadlines and conclude a team member is struggling. In each case, someone is drawing a big conclusion from a tiny amount of data. In this lesson, you will discover why small samples can paint a wildly misleading picture — and why that is not a flaw in probability but a predictable feature of randomness. By the end, you will be able to:
- Explain why small samples produce unstable results and why larger samples pull observed frequencies closer to the true probability.
- Spot real-world situations where people leap to strong conclusions from too little data.
- Apply two quick questions to any striking result to judge whether it reflects a genuine pattern or just small-sample noise.
When you estimate a probability from real data, the number of observations you use matters enormously. Think of it this way: if you visit a new city for just one day and it rains the entire time, you might assume the city is dreary and wet. But if you visited ten different times throughout the year, you would get a much more balanced picture of what the weather is actually like. One visit simply is not enough to judge.
Probability works the same way. Fewer observations mean more room for the results to stray from the underlying probability. A handful of data points can easily land on the lucky or unlucky side of chance, producing an observed frequency that looks nothing like the true rate. More observations allow the lucky and unlucky outcomes to balance each other out, pulling the estimate closer to reality. This idea — that small samples are inherently less stable — is the theme running through everything we cover today.
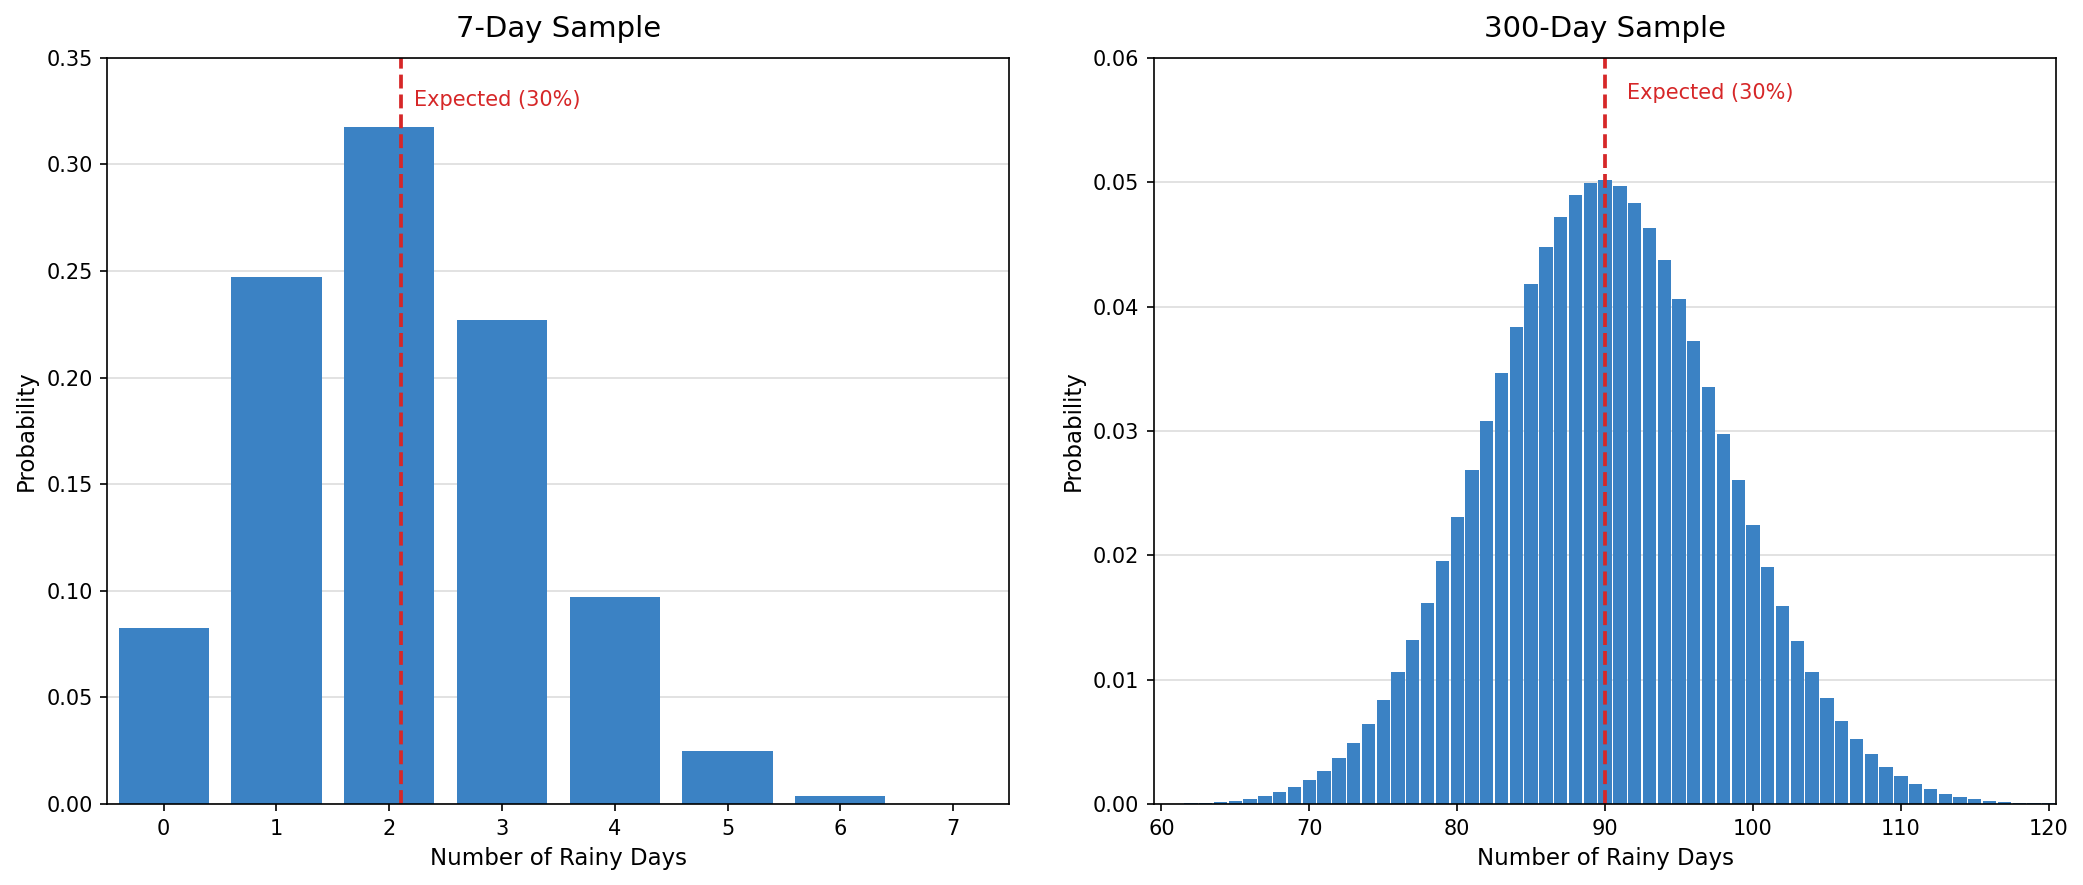
Let's make this concrete. Suppose the true probability of rain on any given day in your city during April is 30%. If you look at just one week (7 days), it would not be unusual to see 0 rainy days, or 4, or even 5. Each of those results looks very different from 30%, yet none of them prove the forecast was wrong.
Now imagine tracking 300 days that each carry the same 30% rain chance. Over that many days, getting 25% or 35% rainy days is quite plausible, but getting 0% or 70% would be almost unheard of. The larger group of observations keeps the observed frequency much closer to the true 30%.
Why does this happen? Each individual outcome is partly governed by chance. With only a few observations, a short run of luck in either direction dominates the total. With many observations, those lucky and unlucky streaks blend together, pulling the average back toward the true probability.
One powerful way to see the fragility of small samples is to watch what happens when a single new data point arrives. Consider a product that has received 5 reviews, all rated 5 stars, giving it a perfect average of 5.0. Now one more customer leaves a 1-star review. Because there are only 6 reviews total, that one unhappy customer makes up a significant chunk of all the feedback. The result? The average drops all the way to about 4.3 stars — a swing of nearly 0.7 stars from just one person's opinion.
Now compare this with a product that has 300 reviews and a current average of 4.2 stars. If one person leaves a 1-star review, that single voice is just one out of 301 — a tiny fraction of the total. The average barely budges, dipping to roughly 4.19 stars, a change so small you would not even notice it.
The difference comes down to how much weight each individual review carries. With only a few reviews, every single one has a big say in the final number. With hundreds of reviews, no single opinion can move the needle much. This is exactly why small samples feel so unpredictable — each new observation has the power to dramatically reshape the picture.
This idea shows up constantly in daily life. Here are a few situations where small-sample thinking can lead us astray:
- Test scores: A student scores 95% on one quiz and concludes they have completely mastered the material. But that quiz only had 10 questions, so getting one or two lucky guesses could easily inflate the result. If the same student took a comprehensive exam with 100 questions covering the same material, the score would give a much more reliable picture of what they actually know.
- Work performance: A colleague makes 3 errors in one week and someone concludes their performance is declining. In any short stretch, random variation can cluster mistakes together. A few bad days do not establish a trend.
- Deliveries: If 3 out of your last 5 online orders arrived late, it might feel like the shipping company has a serious problem. But with only 5 orders, a 60% late rate can happen by chance even if the company's true late rate is just 15% or 20%.
The common thread is that people tend to treat small samples as though they are just as reliable as large ones. They are not. A small sample gives us a rough sketch, not a detailed photograph, of the underlying reality.
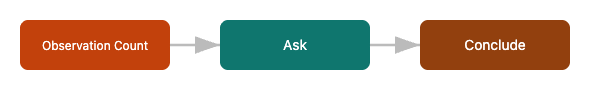
Whenever you encounter a striking result, a helpful habit is to ask two questions:
- How many observations produced this result?
- Could normal randomness explain what I see?
If the answer to the first question is "only a few" and the answer to the second is "yes," then there is no need to search for a deeper explanation. The variability is simply what randomness looks like when the sample is small. This does not mean small samples are useless — they still carry some information. It means you should hold your conclusions lightly and wait for more data before treating the result as a reliable signal.
Small samples are naturally unpredictable: with only a few observations, the results can easily look very different from what the true probability would suggest. This does not mean anything went wrong, it is simply how randomness behaves when there is not much data to work with. As you saw, a single observation can shift a small-sample result by a huge amount while barely moving a large-sample result. The practical takeaway is to be cautious about strong conclusions drawn from just a handful of cases, whether those cases are product reviews, work incidents, or delivery records.
Now it is time to sharpen this skill with some hands-on practice. You will judge whether real-life results are truly surprising or just small-sample noise, compare ratings with very different amounts of evidence behind them, and decide which everyday conclusions hold up to scrutiny. Let's see how well you can separate signal from noise!
