Welcome to Explain Unexpected Outcomes! Whether you've picked up your probability knowledge from a previous course or from everyday experience, you are now ready to explore a question that puzzles many people: why do real results so often look different from what probability predicts?
In this lesson, you will learn to:
- Define theoretical probability and observed frequency as two distinct concepts.
- Classify a probability statement as theoretical or observed based on where the number comes from.
- Explain why observed results can differ from theoretical predictions without anything being wrong with the model.
Imagine someone tells you a fair coin lands on heads 50% of the time. You flip that coin 10 times and get heads 7 times. Does that mean the coin is unfair? Probably not, but it does highlight something important: the number you calculate from a model and the number you measure from real flips are two different things.

Probability tells us about chance, not certainty. This lesson sharpens that idea by giving each side of the story its own name and definition, so you can talk about them precisely. Once the distinction is clear, you will find it much easier to explain why real-world outcomes sometimes look "wrong" even when nothing is wrong at all.
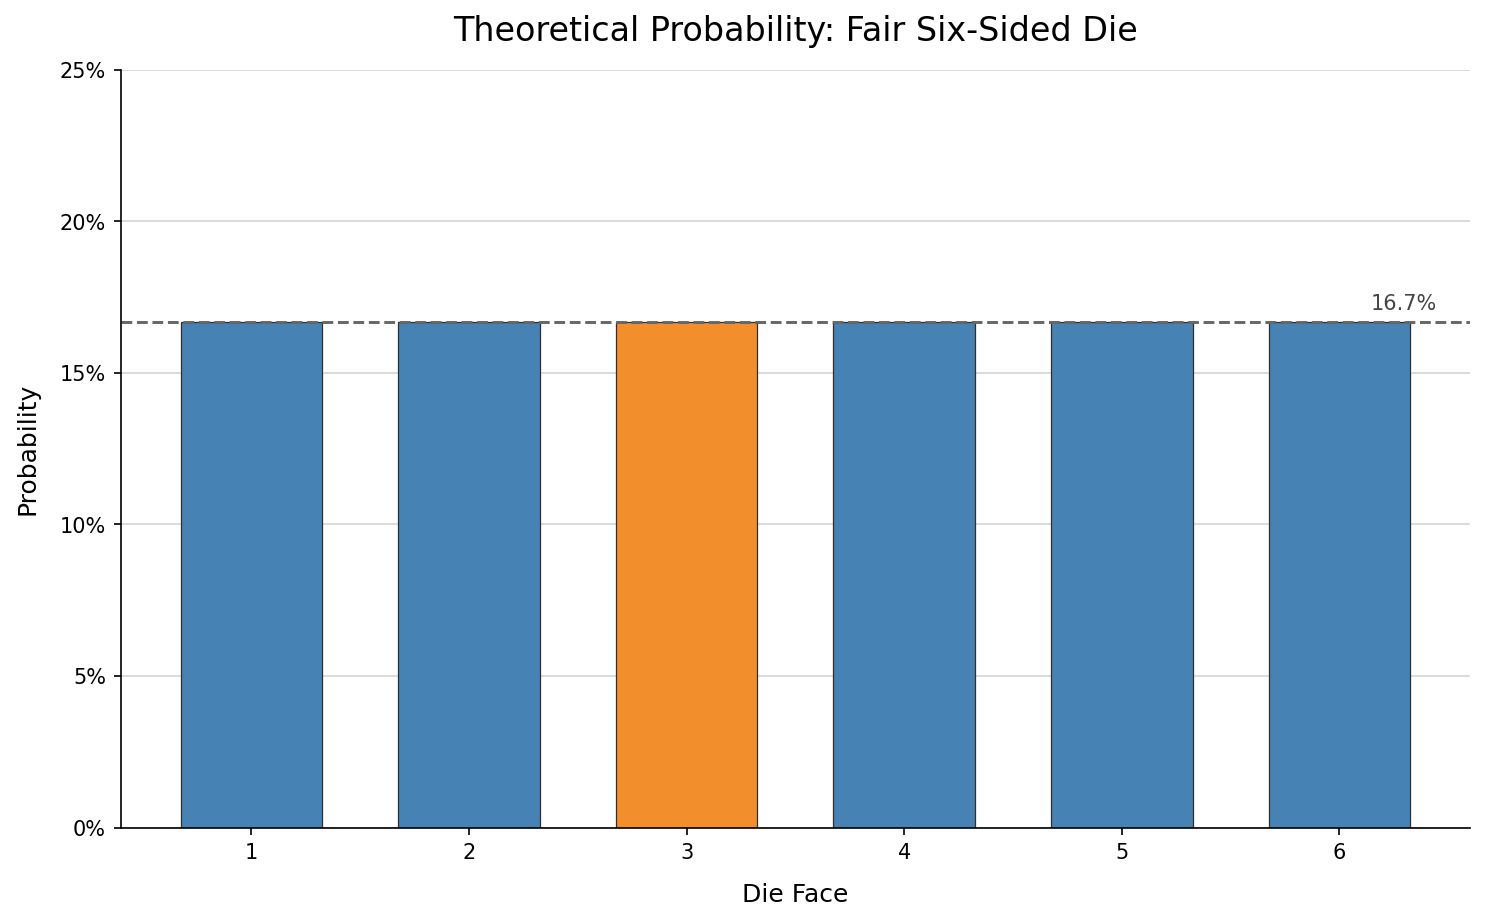
Theoretical probability is what you expect to happen based on how something is set up, before you look at real results. You can figure it out by thinking about all the possible outcomes.
For a standard six-sided die, each face is equally likely, so the theoretical probability of rolling a 3 is:
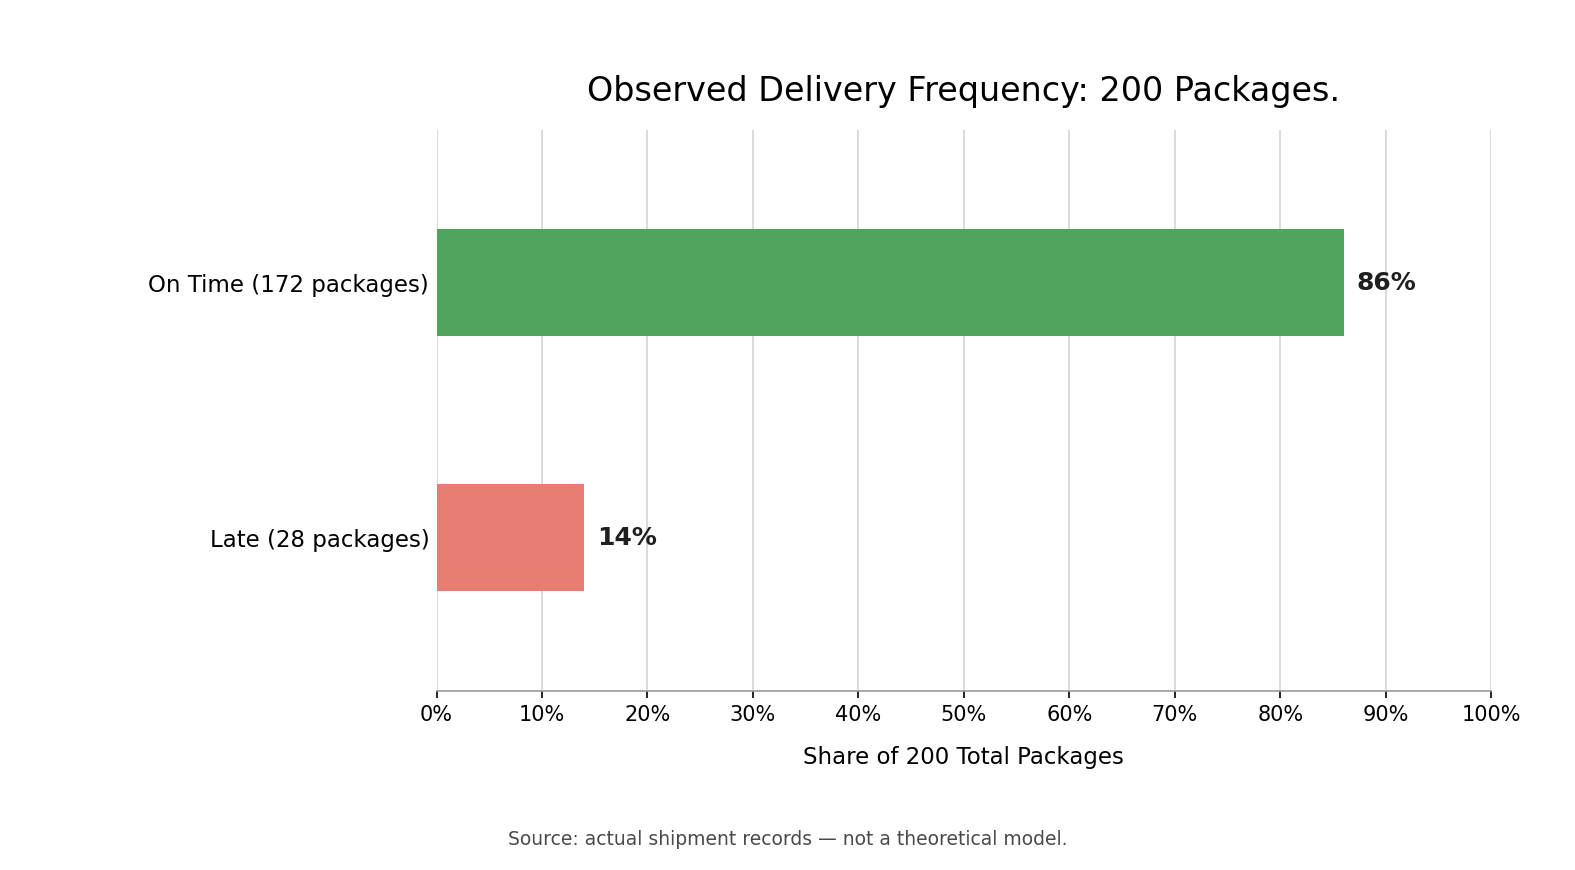
Observed frequency is what actually happened when you tried something and kept track of the results. You find it by counting how often an outcome occurred.
Suppose a delivery company shipped 200 packages last week and 172 arrived on time. The observed frequency of on-time delivery is:
The fastest way to classify a probability statement is to ask one question: "Where did this number come from?"
If the statement relies on assumptions about a process (like equally likely outcomes), it is theoretical. If it relies on counting what actually happened over some period or sample, it is an observed frequency. Practicing this one question will make the distinction feel automatic in no time.
When you do not have a theoretical model, observed frequency is our best tool for estimating the true probability. A restaurant does not have a neat formula for how likely a customer is to order dessert, but if 60 out of 200 diners ordered dessert last month, you can estimate that probability at about .
Crucially, this estimate is an approximation, not an exact answer. A different month might yield 27% or 33%. The precision of the estimate depends heavily on the sample size — the number of observations you collect. Ten deliveries tell us much less than ten thousand. As the sample size grows, the observed frequency tends to settle closer and closer to the underlying probability, something you will explore in depth in the upcoming lessons of this course.
Let's recap the key ideas. Theoretical probability is derived from a model and stays fixed, while observed frequency is measured from real data and can shift from sample to sample. When no model exists, you use observed frequency to estimate probability, and those estimates grow more reliable as you collect more data. A gap between theoretical probability and observed results is completely normal in small samples and does not, by itself, prove anything is wrong with the model.
Now it is time to put these ideas into action. In the practice section ahead, you will classify probability statements, compute an observed frequency from raw data, and explain why real outcomes can differ from theoretical predictions. Let's see how sharp your new lens is!