Welcome to Understanding How Results Stabilize Over Time! You have reached lesson three of four, so the finish line for this course is in sight. So far, you have covered important ground: the first lesson drew a clear line between theoretical probability and observed frequency, and the second lesson showed how small samples can paint a wildly misleading picture. Both lessons focused on why real results deviate from what probability predicts. Now let's flip the perspective and ask: what pulls those results back?
The central idea is that observed results do not stay wild forever. As the number of observations grows, the observed proportion gradually settles closer to the theoretical probability. In this lesson, you will learn to:
- Describe why observed proportions gradually settle closer to the theoretical probability as the number of observations grows.
- Identify the Law of Large Numbers and explain what it promises about large samples.
- Distinguish between the proportion getting closer to the true rate and the raw count matching it exactly, avoiding the common expectation that large samples produce a perfect match.
In the previous lesson, you compared a small sample to a rough sketch of reality. Let's extend that image. Imagine assembling a jigsaw puzzle: with only a few pieces in place, the picture is mostly gaps and guesswork. Each new piece adds clarity, and after enough pieces the image becomes unmistakable, even though a few pieces may still be missing.
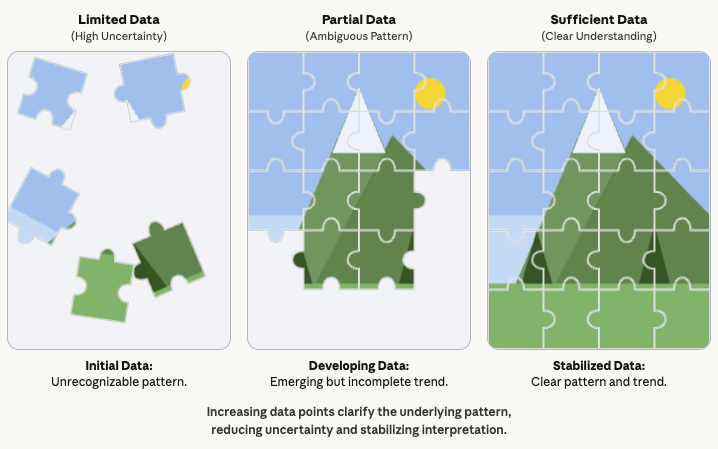
Data works the same way. Early observations hint at the overall pattern but leave plenty of room for wrong impressions. As we add more observations, the picture sharpens. This gradual sharpening is exactly what we mean when we say results stabilize over time, and it is the focus of everything we cover today.
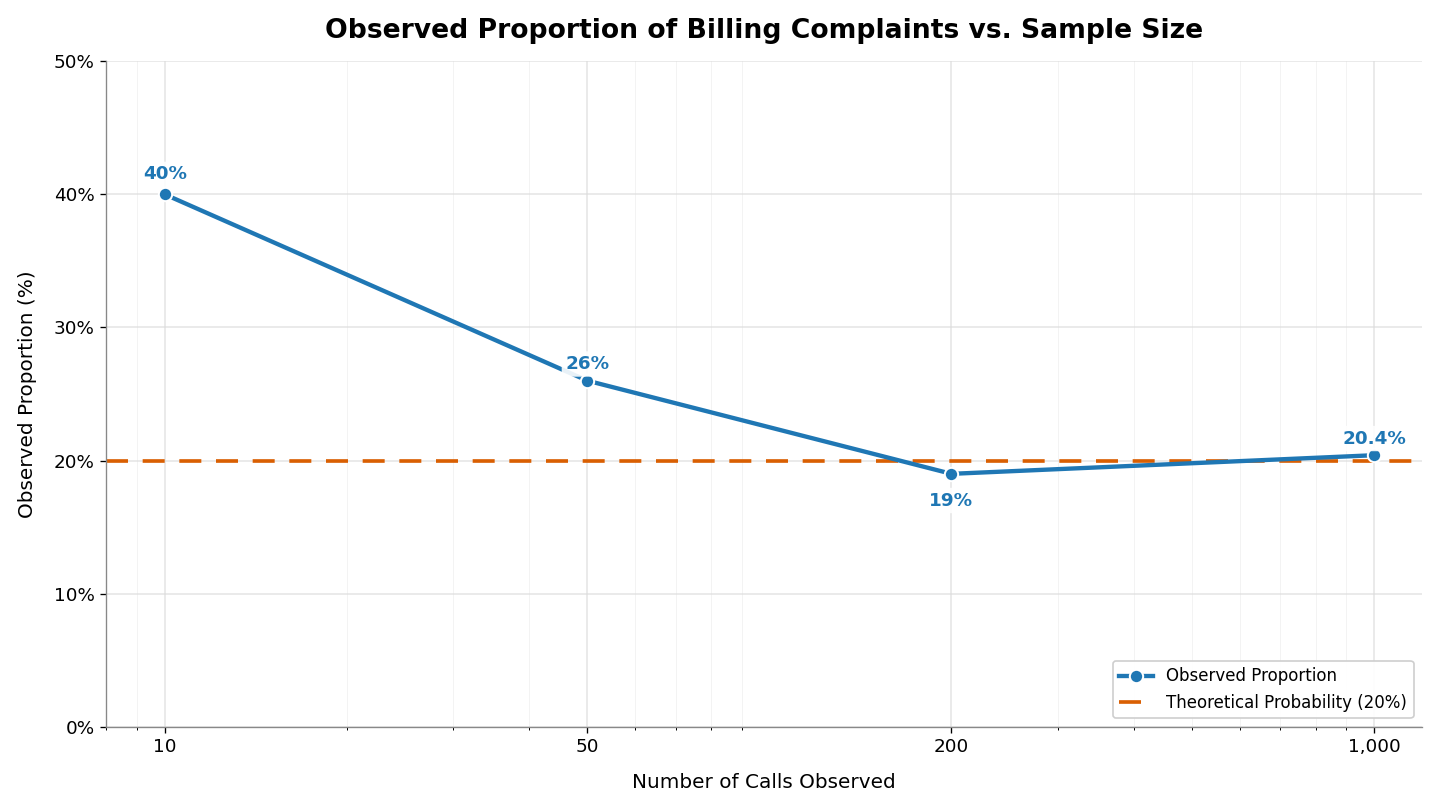
Let's walk through a concrete example. Suppose a call center knows from years of records that 20% of incoming calls are billing complaints. A new manager starts tracking calls on their first day.
After 10 calls, they have seen 4 billing complaints. That gives an observed proportion of , or 40%, which is double the true rate. Ten observations is a small sample, so this gap is not alarming. They keep tracking and after 50 calls, there are 13 billing complaints: , or 26%. After 200 calls, 38 are billing complaints: , or 19%. After , they record 204 billing complaints: , or 20.4%.
This pattern has a formal name: the Law of Large Numbers. In plain language, it means that as you repeat something more and more times, your results tend to get closer to what you expect.
This idea explains why we trust large surveys over small ones and why a baseball player's batting average becomes more meaningful as the season progresses. The more data you collect, the closer your results usually get to the theoretical probability.
The Law of Large Numbers promises that the observed proportion approaches the theoretical probability, but it does not promise an exact match at any finite point.
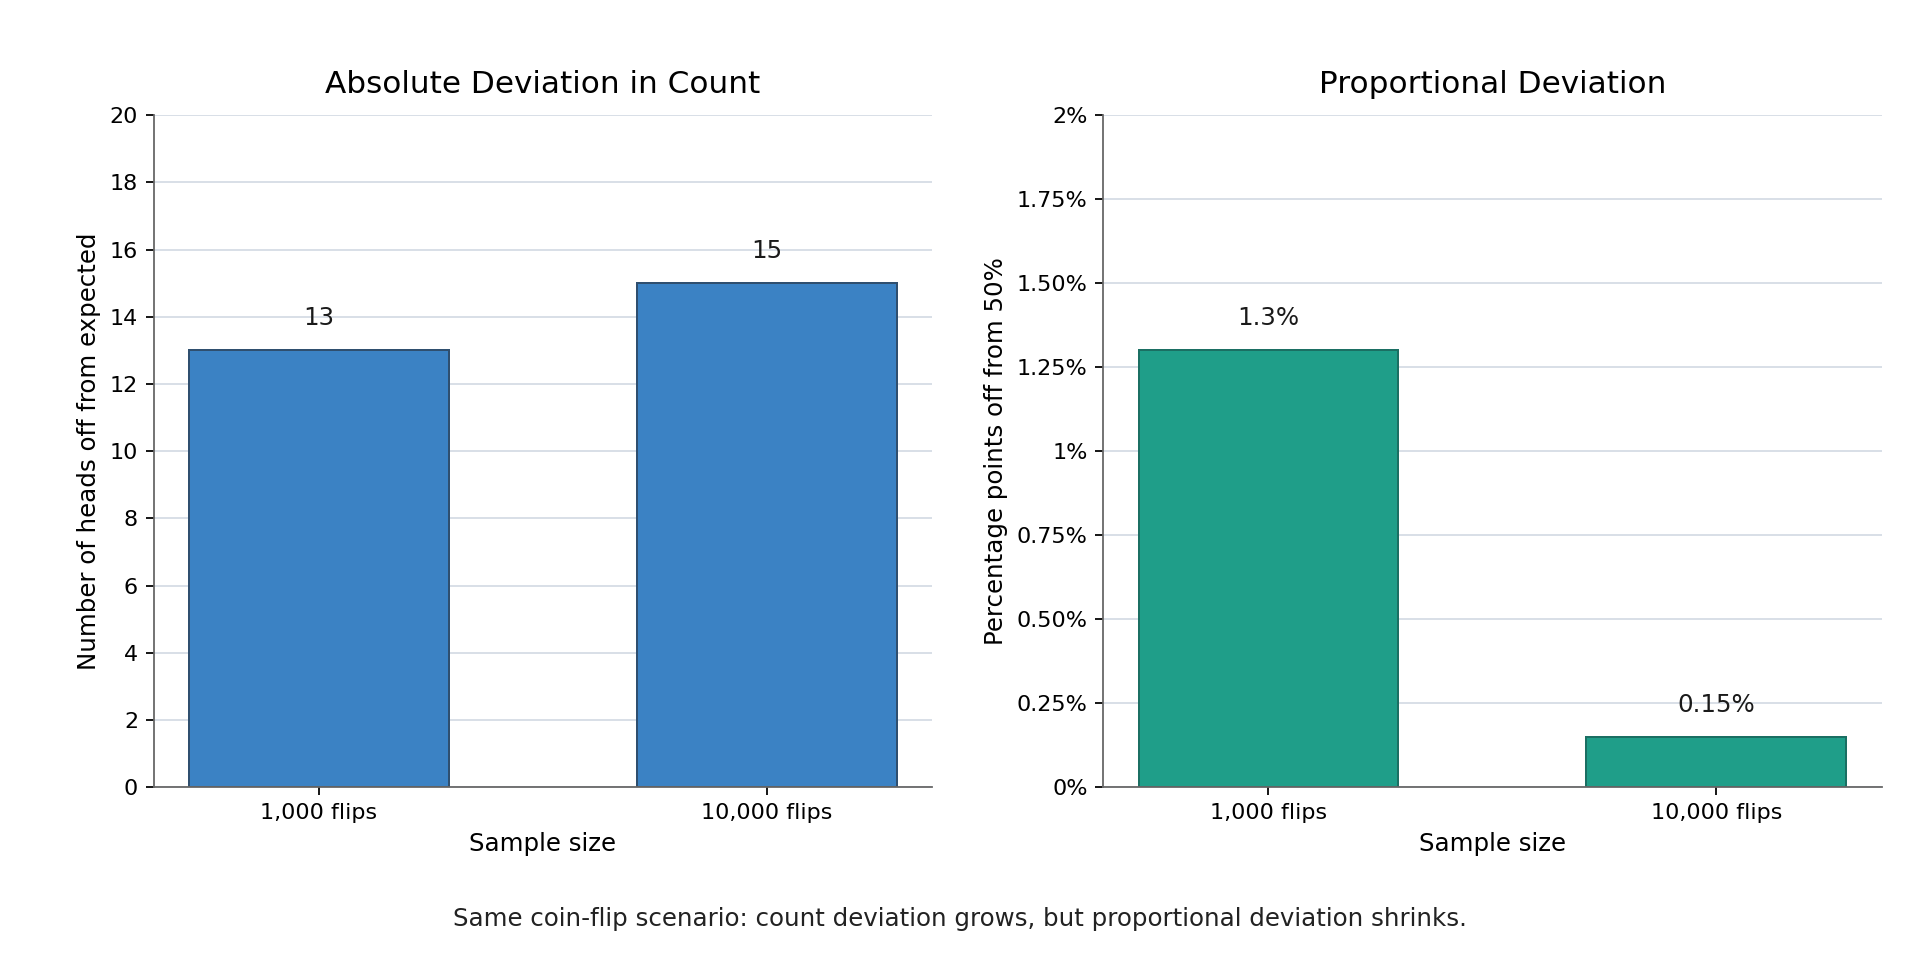
Consider a fair coin with a 50% chance of heads. If you flip it 1,000 times, you might get 513 heads, for an observed proportion of 51.3%. That is close to 50% but not a perfect hit. If you flip it 10,000 times, you might see 4,985 heads, or 49.85%. Even closer, yet still not exactly 50%.
In fact, the count of heads can wander further from the "expected" count even as the proportion tightens. After 1,000 flips you might be off by 13 heads; after 10,000 flips you might be off by 15. The absolute gap in count can grow, but the proportion narrows because you are dividing by a much larger number:
A natural question is: how many observations do you need before you can trust the results? There is no single magic number, because the answer depends on the situation and on how much precision is needed. However, a few practical benchmarks can help build this intuition:
- Tens of observations are usually too few for confident conclusions. The call center manager's 10-call result of 40% was off by 20 percentage points.
- Hundreds of observations typically bring the proportion within a few percentage points of the truth. Their 200-call result of 19% was only 1 point away from 20%.
- Thousands of observations tend to narrow the gap to less than a percentage point, which is reliable enough for most everyday decisions.
These are rough guidelines, not strict cutoffs. Reliability is a gradual process: we do not flip a switch from "unreliable" to "reliable" at some fixed sample size. Instead, our confidence grows steadily as data accumulates.
Consider a real-world example. If a new medication is tested on 15 patients and helps 80% of them, that figure could easily be off by 15 or 20 percentage points. If it is tested on 5,000 patients and helps 62%, the true rate is very likely within a point or two of that number. The larger study gives us a much tighter window around reality, making it far more useful for decisions.
The central lesson is that observed proportions stabilize as you collect more data. Each new observation has a smaller effect on the overall proportion, gradually pulling the result toward the theoretical probability. The formal name for this idea is the Law of Large Numbers, and it is one of the most practically useful facts in all of probability. At the same time, "stabilize" does not mean "match perfectly" — even very large samples leave a small gap between the observed proportion and the true rate, but that gap shrinks to a size that rarely matters for real decisions.
Now it is time to put these ideas into action. In the upcoming practice exercises, you will compare small and large samples side by side, estimate plausible ranges for real scenarios, and explain in your own words when probability predictions start earning our trust. Let's see how sharp your stabilization instincts have become!