Welcome back to Document Structure and Layout! This is lesson five of seven, which means you are well past the halfway mark. So far, you have organized headings, generated a table of contents, built lists, and fine-tuned page margins. Each of those skills shapes a different part of a polished document, and now we add one more: tables. Tables let you present structured data — schedules, measurements, expense reports — in rows and columns that a reader can scan at a glance. By the end of this lesson, you will know how to build neatly aligned tables with borders, header rows, and column-spanning headings using the tabular environment.
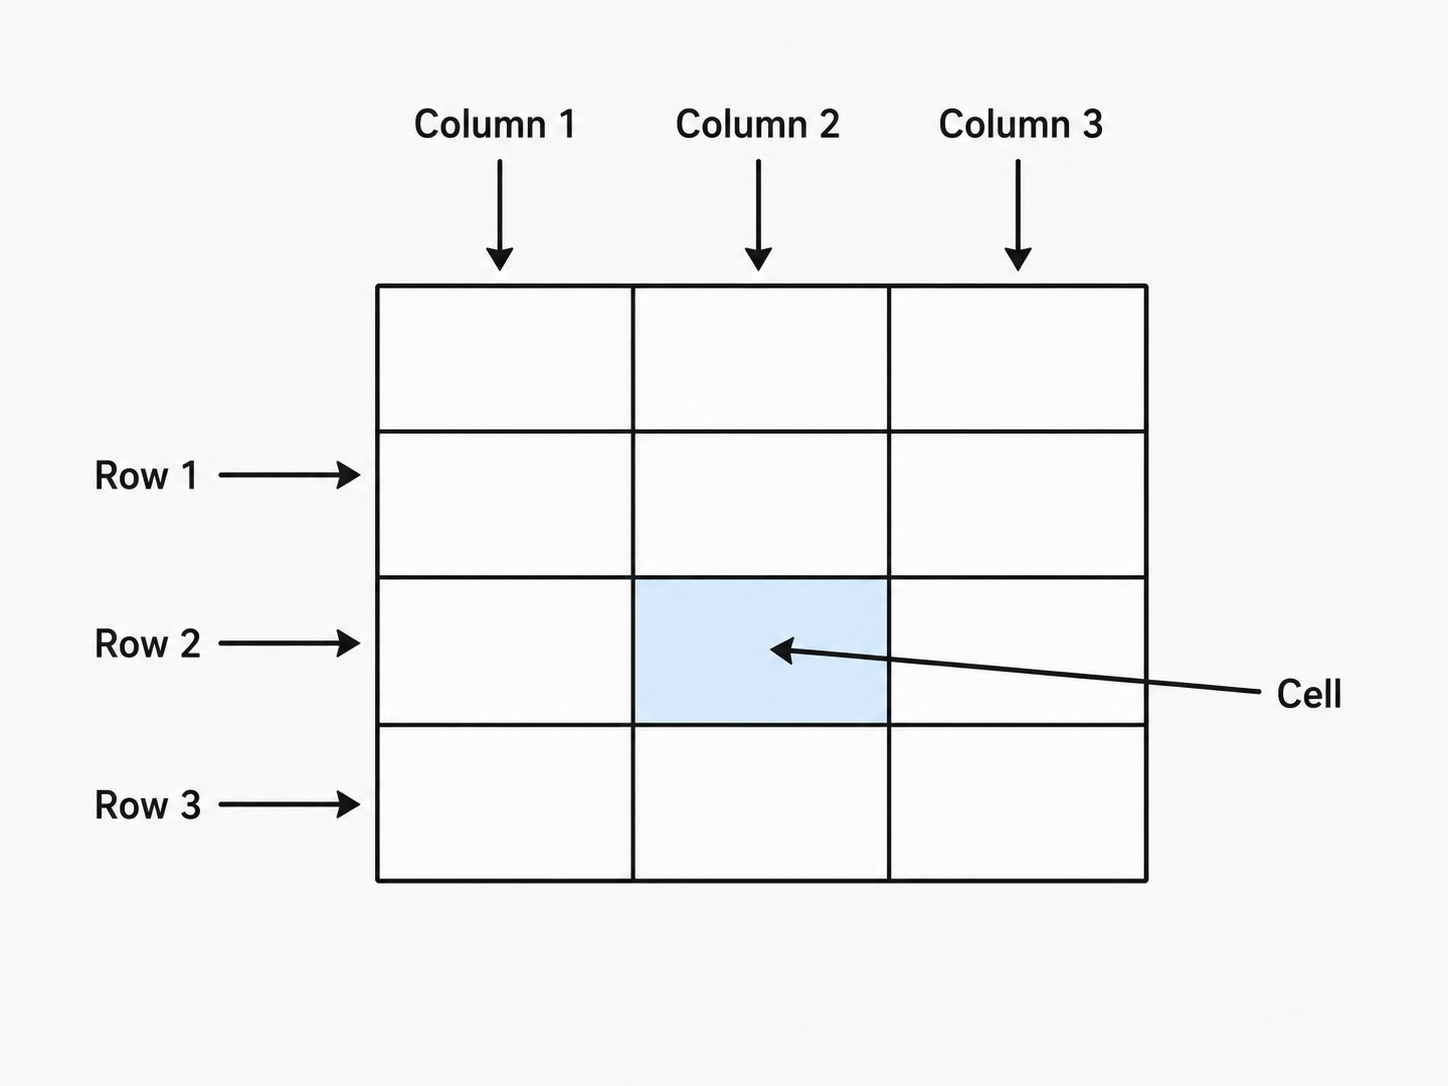
Before we write any code, let's consider what a table really is. A table is a grid of information arranged in rows (horizontal) and columns (vertical), where each box in the grid is called a cell. You see tables everywhere: class schedules, price lists, experiment results, and financial summaries all rely on rows and columns to make comparisons easy at a glance.
In LaTeX, tables are built one row at a time, left to right, inside a dedicated environment, and LaTeX handles all the spacing and alignment for you. The process will feel familiar if you recall how we used environments like itemize and enumerate for lists — you open an environment, supply content following a few simple rules, and close it.
The environment for creating tables is called tabular. When you open it, you provide a column specification that tells LaTeX how many columns the table has and how each one should be aligned. The three basic column specifiers are:
l— left-aligned columnc— center-aligned columnr— right-aligned column
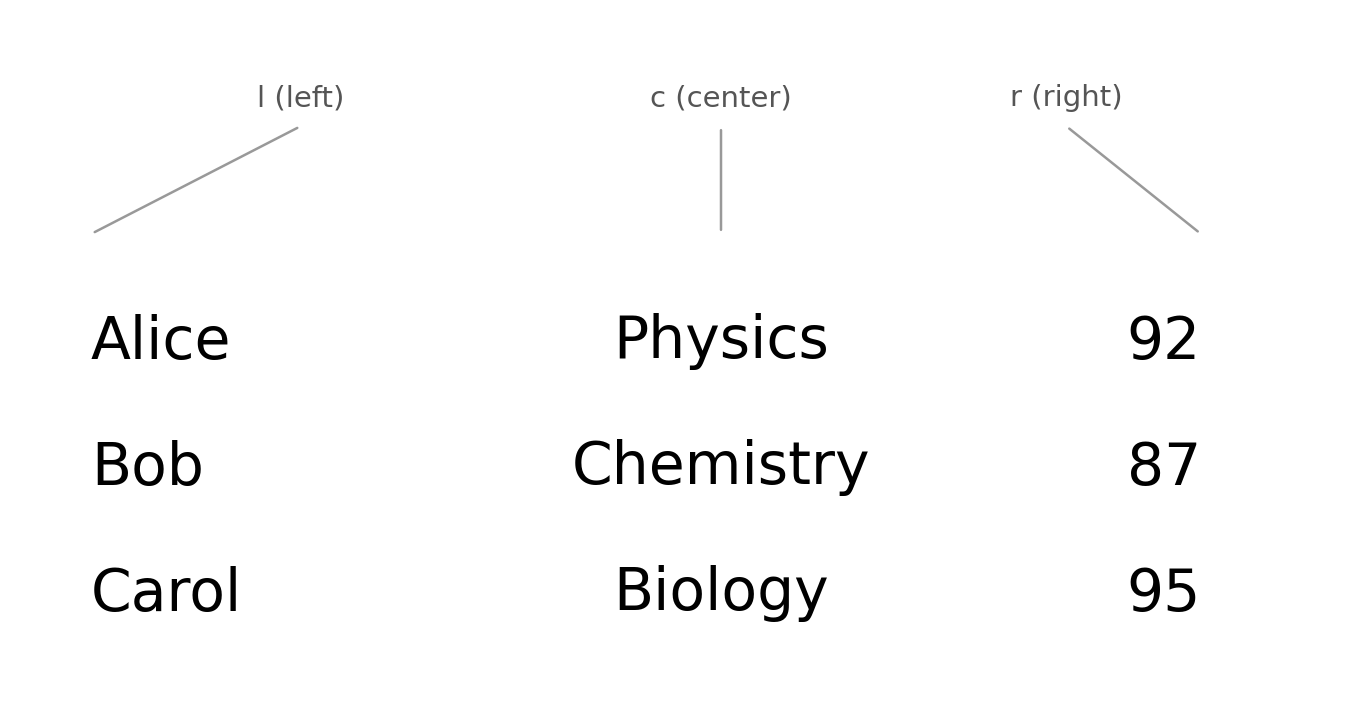
Inside the environment, you separate cells in a row with the ampersand character & and signal the end of each row with a double backslash \\. Here is a simple three-column table:
The column specification {l c r} creates three columns: the first left-aligned, the second centered, and the third right-aligned. Spaces inside the specification are optional and ignored by LaTeX, so {lcr} works identically. Each row contains exactly three cells separated by &, and every row ends with \\. The final row's \\ is technically optional, but including it is a good habit that prevents errors when you add more rows later.
When compiled, this code produces a clean, borderless grid where each column respects its alignment specifier. Names hug the left edge, subjects sit in the center, and scores align to the right.
A borderless table works fine for small data sets, but larger tables benefit from lines that guide the reader's eye. LaTeX provides two straightforward tools for this: \hline for horizontal rules and the pipe character | in the column specification for vertical rules.
To draw a horizontal line, place \hline on its own line between rows, or at the very top and bottom of the table body. To draw vertical lines, insert | between or outside the column letters in the specification. Here is the same student-scores table with full borders and a labeled header row:
When compiled, the table looks like this:
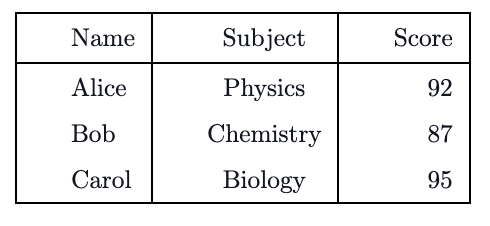
The specification {|l|c|r|} places a vertical rule before the first column, between every pair of columns, and after the last column. The three \hline commands draw horizontal lines at the top, below the header row, and at the bottom of the table. Separating the header from the data with its own \hline makes the table much easier to scan.
Let us bring everything together with a realistic example. Imagine you are keeping a small weekly expense log with columns for the day, the spending category, and the dollar amount. When choosing alignment, a good rule of thumb is: text reads best left-aligned, while numbers are easiest to compare when right-aligned.
When compiled, the expense log looks like this:
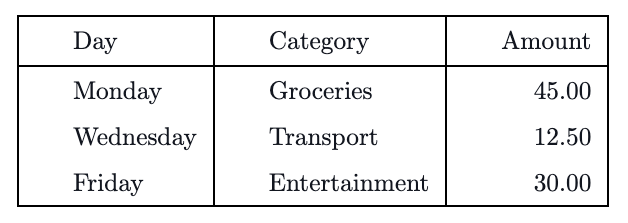
We chose l for the two text columns and r for the numeric column. The header row sits between two \hline commands so it stands out clearly. This pattern — header, rule, data rows, closing rule — is the most common table structure you will encounter, and it works well for nearly any simple data set.
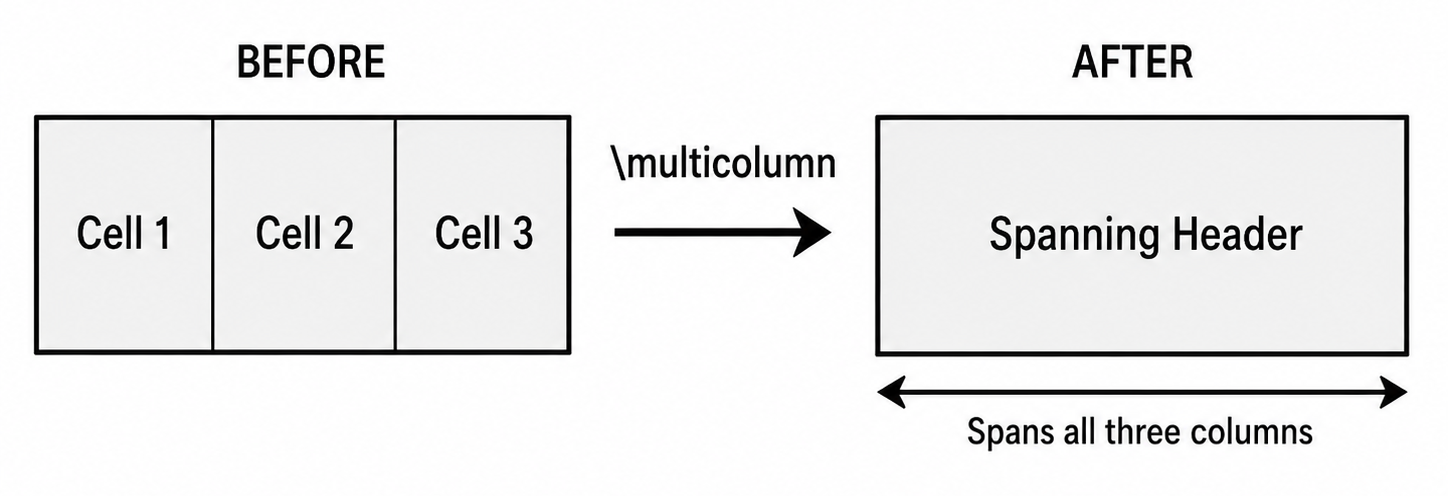
Sometimes a table needs a heading that stretches across more than one column. The \multicolumn command merges several cells in a single row into one wider cell. Its syntax has three required arguments:
- number — how many columns the cell should span.
- alignment — the alignment for the merged cell (
l,c, orr), optionally with|for vertical rules on either side. - text — the content to display in the merged cell.
Here is an example that adds a title row spanning all three columns of our student-scores table:
When compiled, the spanning header appears above the data like this:
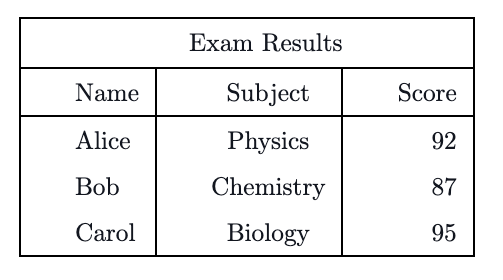
The command \multicolumn{3}{|c|}{Exam Results} replaces the three normal cells in that row with a single centered cell spanning all three columns. Notice that we wrote |c| in the alignment argument so the vertical borders remain consistent with the rest of the table. Without those pipes, the merged cell would lose its side borders even though every other row has them.
You can also span only some columns. For instance, \multicolumn{2}{|c|}{Student Info} would merge just the first two columns while leaving the third column as a separate cell in the same row. This is useful for creating grouped sub-headings above related columns.
In this lesson, you learned how to build tables using the tabular environment. We covered column specifiers (l, c, r), the cell separator &, row terminators \\, horizontal rules with \hline, vertical rules with |, and the \multicolumn command for spanning headings. Together, these tools let you present structured data in a clean, professional format.
Now it is time to get hands-on. In the practice exercises ahead, you will construct tables ranging from simple aligned grids to a complete expense log and a table with spanning headers — let's see your data line up perfectly!
