Welcome back to Data Distributions and Center! With three lessons already under your belt, you are now on lesson four of six — solidly past the halfway mark. So far, you have learned what a data distribution looks like, how to calculate the mean using addition and division, and how to find the median by sorting values and picking the middle position. Today we introduce the third and final measure of center in this course: the mode. Unlike the mean and median, the mode does not require any arithmetic at all. It simply asks, "Which value shows up the most?" Let's take a closer look.
When we call the mode a measure of center, we do not mean it must sit in the numerical middle of a dataset. Instead, "center" here means a value that represents what is most typical or most common in the data. The mode tells us which value or category occurs most often, so it captures a common experience in the dataset even if that value happens to be near one end rather than the middle.
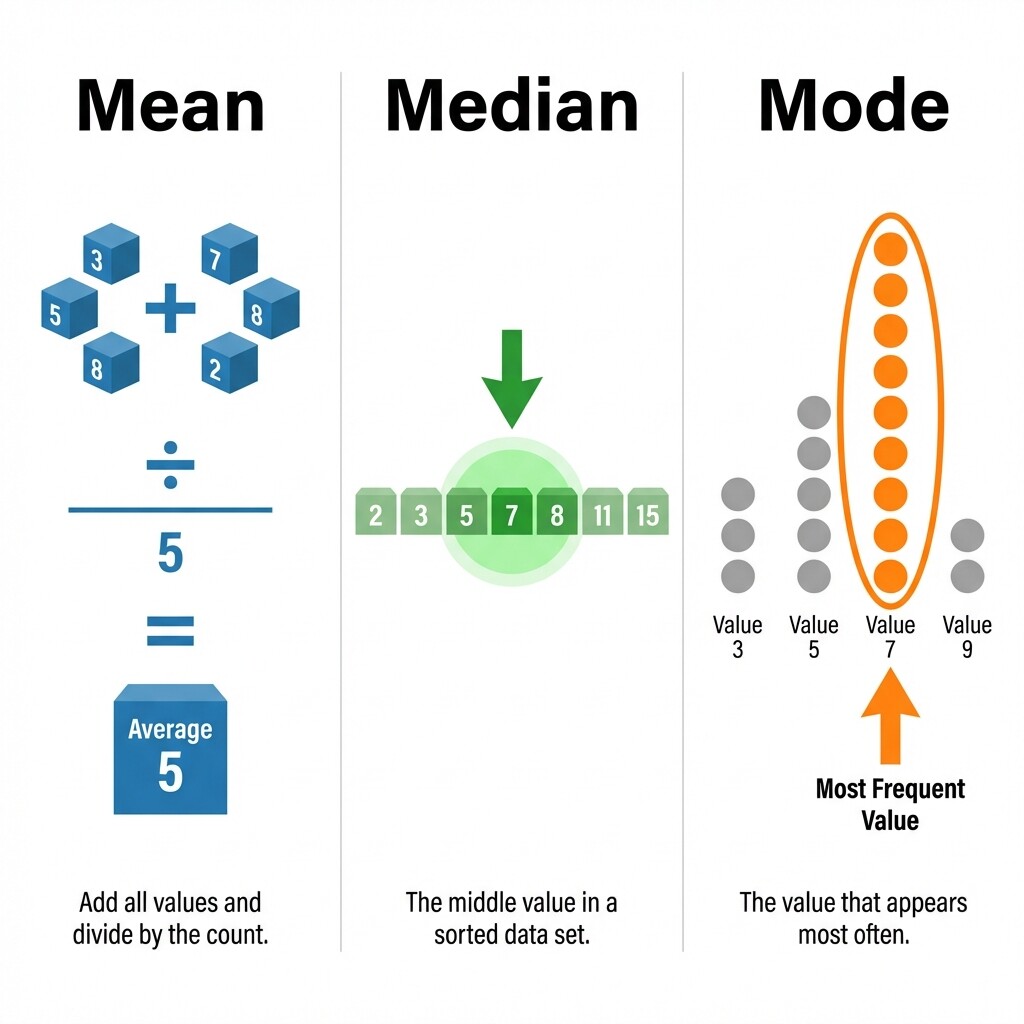
This is different from the mean and median, which define center using balance or middle position. The mode defines center through frequency — what shows up the most. Keeping that difference in mind will help you decide when the mode is useful and what kind of story it tells.
The mean and the median both rely on numerical operations — the mean adds every value together, while the median requires sorting and sometimes averaging. The mode takes a completely different path. It focuses on frequency, which is just a count of how many times each value appears in the dataset.
Because the mode only involves counting, it can do something the mean and median cannot: it works with non-numerical (categorical) data as well. If you survey people about their preferred payment method, you cannot calculate a mean or median of "cash," "card," and "mobile pay." But you can identify which option was chosen most often — and that is the mode. This flexibility makes the mode a uniquely versatile measure of center.
To find the mode of any dataset, follow two simple steps:
- Count how many times each distinct value appears.
- Identify the value (or values) with the highest count.
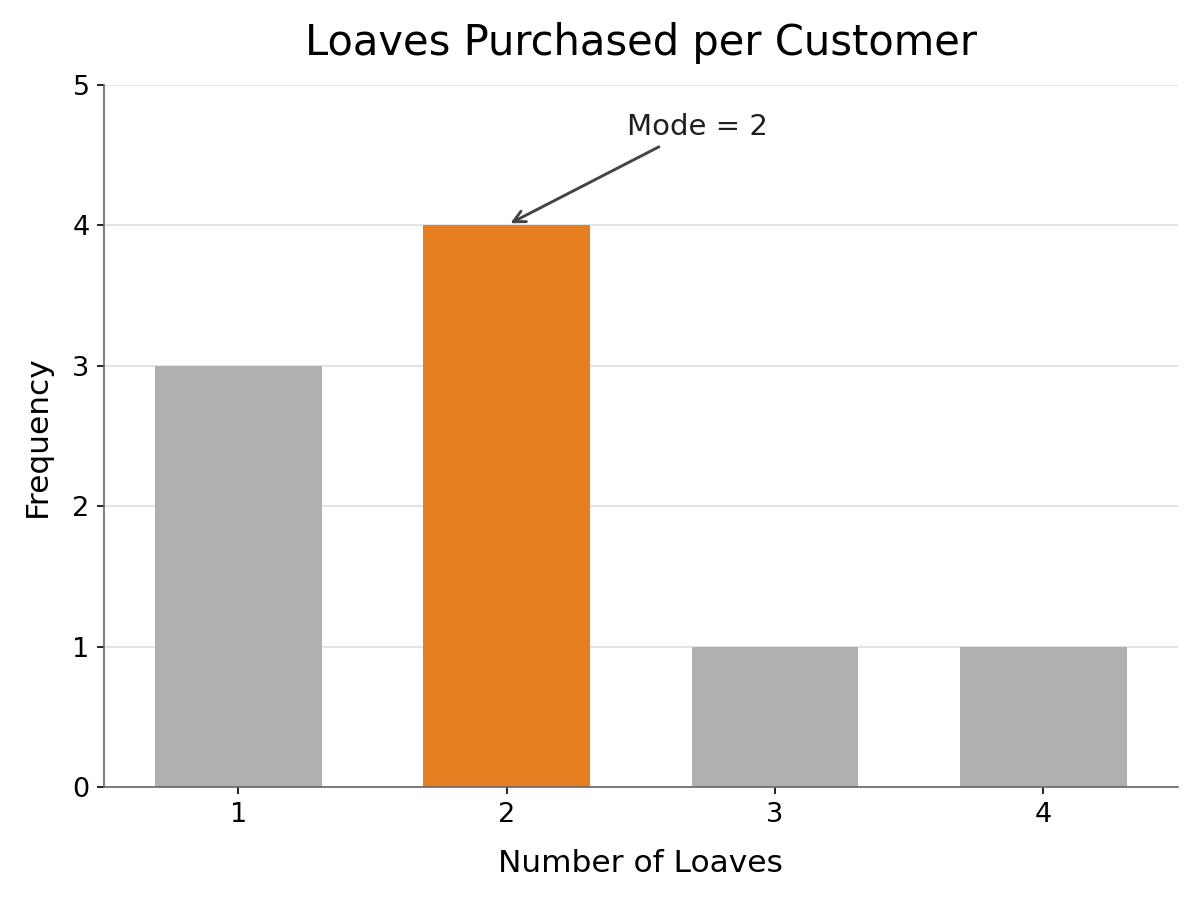
Let's try an example. A small bakery tracks how many loaves of bread each customer buys during one morning:
Sometimes every value in a dataset appears the same number of times. When that happens, no single value stands out as more frequent, and we say the dataset has no mode.
Consider the ages of five coworkers on a project team:
Each age appears exactly once. Because no value repeats more than any other, this dataset has no mode. The same conclusion applies whenever all values share the same frequency — whether each appears once, twice, or any other equal number of times.
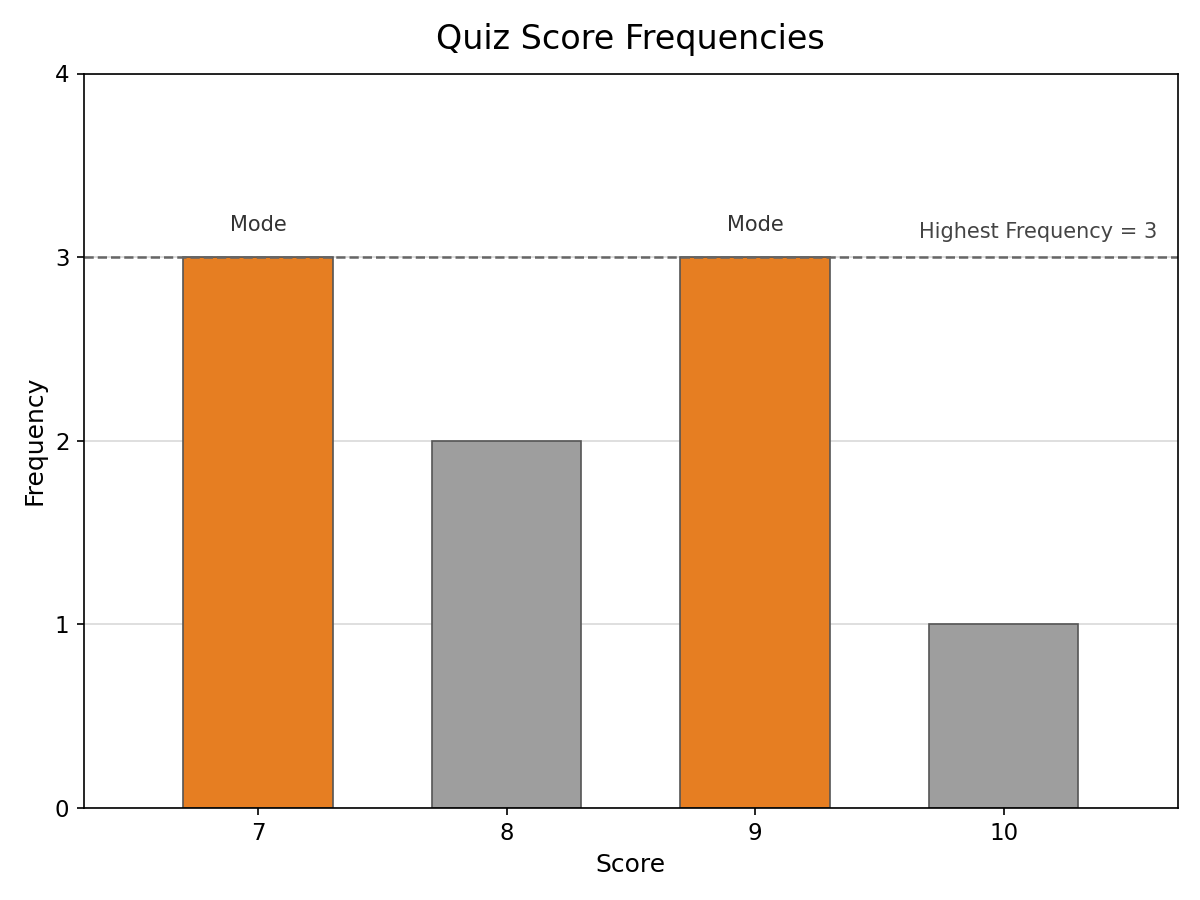
A dataset can also have more than one mode. If two or more values tie for the highest frequency, each of them is a mode.
- Bimodal means exactly two values share the top frequency.
- Multimodal means three or more values share the top frequency.
Here is a quick example. A teacher records quiz scores for a small class:
Earlier we noted that the mode is the only measure of center that applies to categorical data. Whenever data consists of labels or categories rather than numbers, the mean and median simply have no meaning — but the mode is perfectly useful.
Imagine a coffee shop asks 12 morning customers which drink they ordered:
Before you head into practice, here is a quick reference for the three possible outcomes when identifying the mode:
In this lesson, we learned that the mode is the most frequently occurring value in a dataset. We explored how to find it by counting frequencies, and we saw three possible outcomes: no mode, exactly one mode, or more than one mode. We also discovered that the mode stands apart from the mean and median because it works with categorical data, not just numbers.
Now it is time to put your counting skills to work! Up next, you will practice spotting modes in real-world scenarios — from shoe-size purchases and survey responses to café lunch orders. Dive in and see how naturally the mode reveals the most popular choice in any dataset!