Welcome back to Data Distributions and Center! You have now reached lesson three of six, which means you are already halfway through the course. In our first lesson, we explored what a data distribution looks like and how to describe the overall shape of a dataset. In our second lesson, we learned how to compute the mean by summing every value and dividing by the count. Today we turn to a different measure of center: the median. While the mean uses every value in its calculation, the median takes a completely different approach and focuses on position. Let's see how it works.
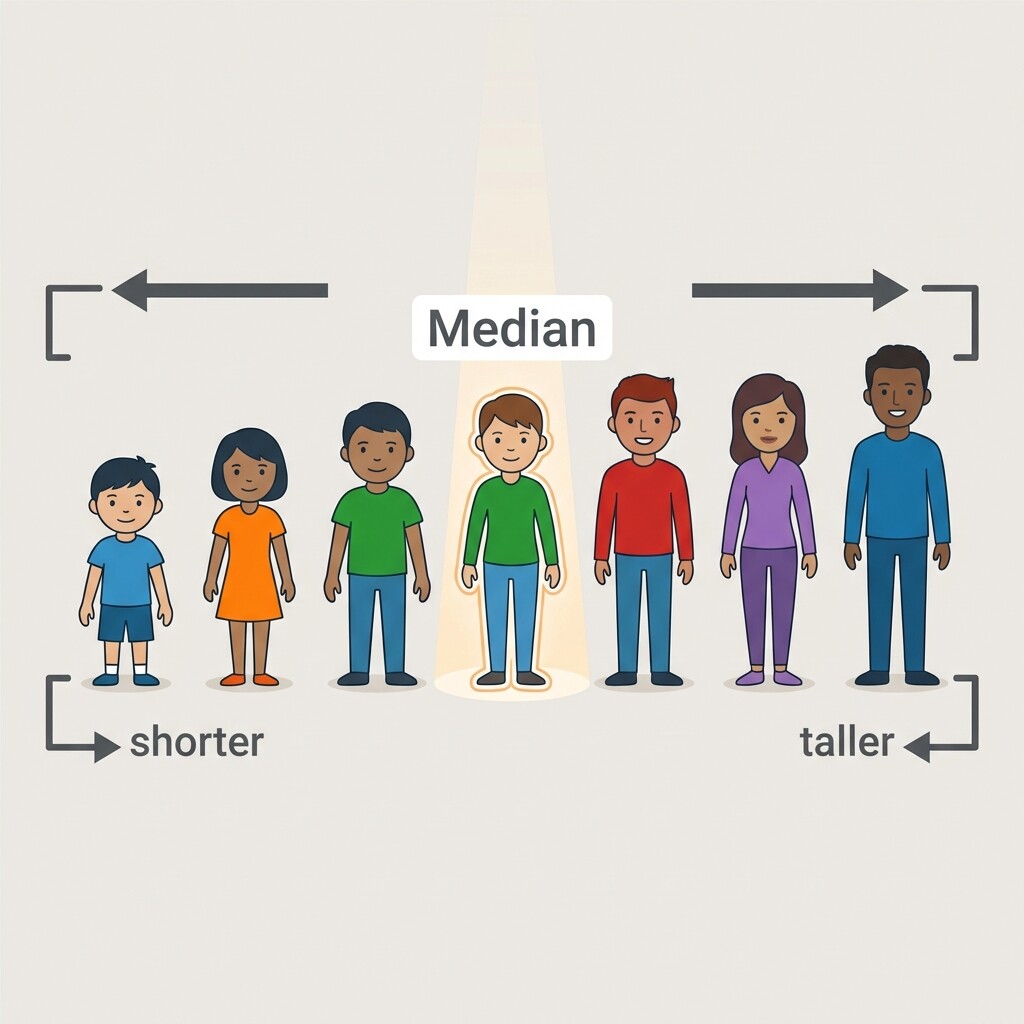
Imagine lining up a group of people from shortest to tallest and then pointing to the person standing right in the middle. That person's height represents the center of the group — not because of any arithmetic, but simply because of where they stand. This is exactly what the median does with data.
The median is the middle value of a dataset once all the values have been arranged in order from least to greatest. Instead of combining every number the way the mean does, it asks a simpler question: "Which value sits at the center of the sorted list?" This positional approach makes the median especially useful in situations where a few very large or very small values might distort the mean — but we will explore that idea more in a later lesson. For now, our focus is on the calculation itself.
The very first thing we must do before finding the median is sort the dataset in ascending order (smallest to largest). This step is essential because the median depends entirely on position. If the values are not sorted, we cannot identify which one is truly in the middle.
Consider this small dataset of daily high temperatures (in °F) recorded over five days:
After sorting from least to greatest, the list becomes:
How we find the median depends on whether the dataset has an odd or even number of values. Let's start with the simpler case: an odd count.
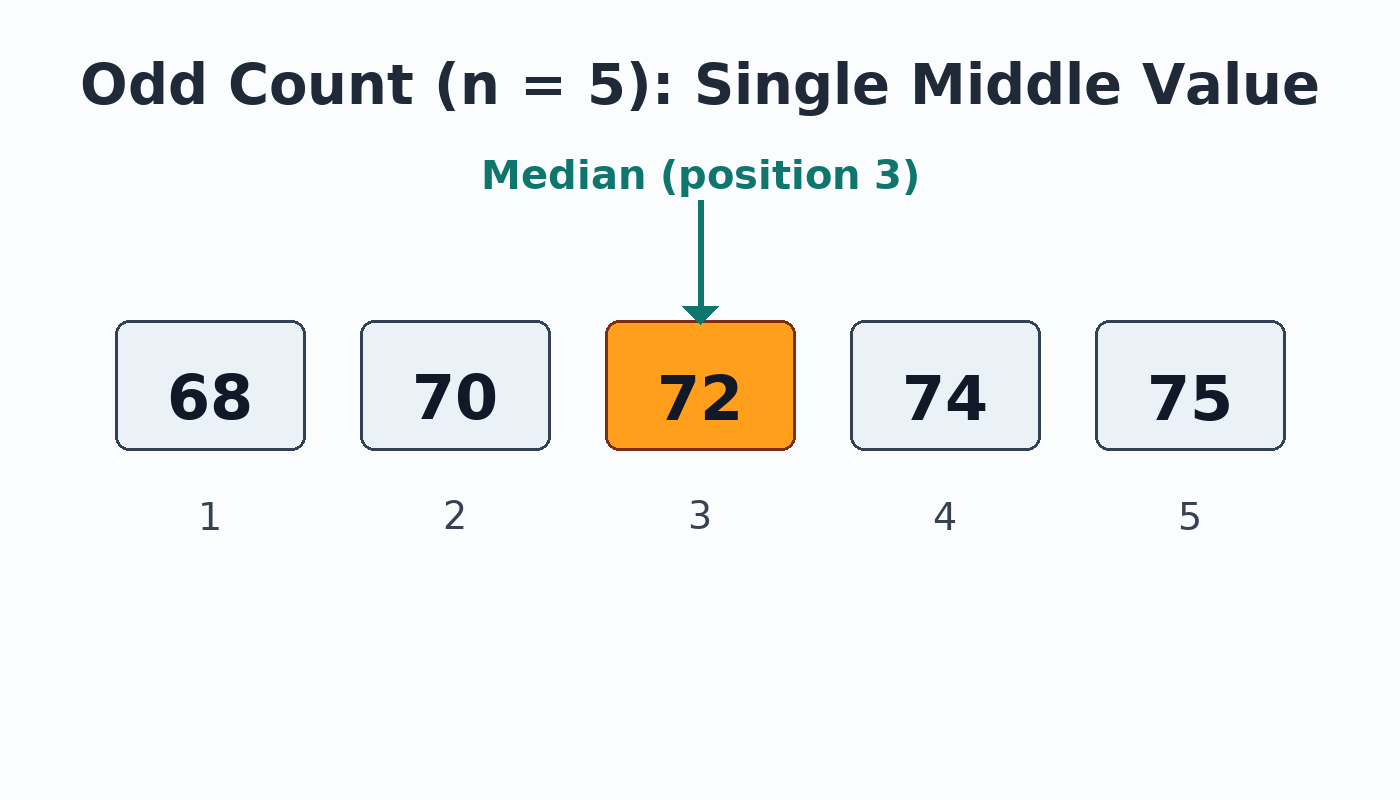
When there is an odd number of values, exactly one value sits in the center. We can find its position with a short formula. For a dataset with values, the middle position is:
In our temperature example, , so the middle position is . That means the in the sorted list is the median. Looking back at our ordered data:
When the dataset has an even number of values, there is no single middle entry. Instead, two values share the center, and we find the median by taking their average (their sum divided by two).
Let's work through an example. Suppose six students reported how many hours they studied last week:
Sort the values:
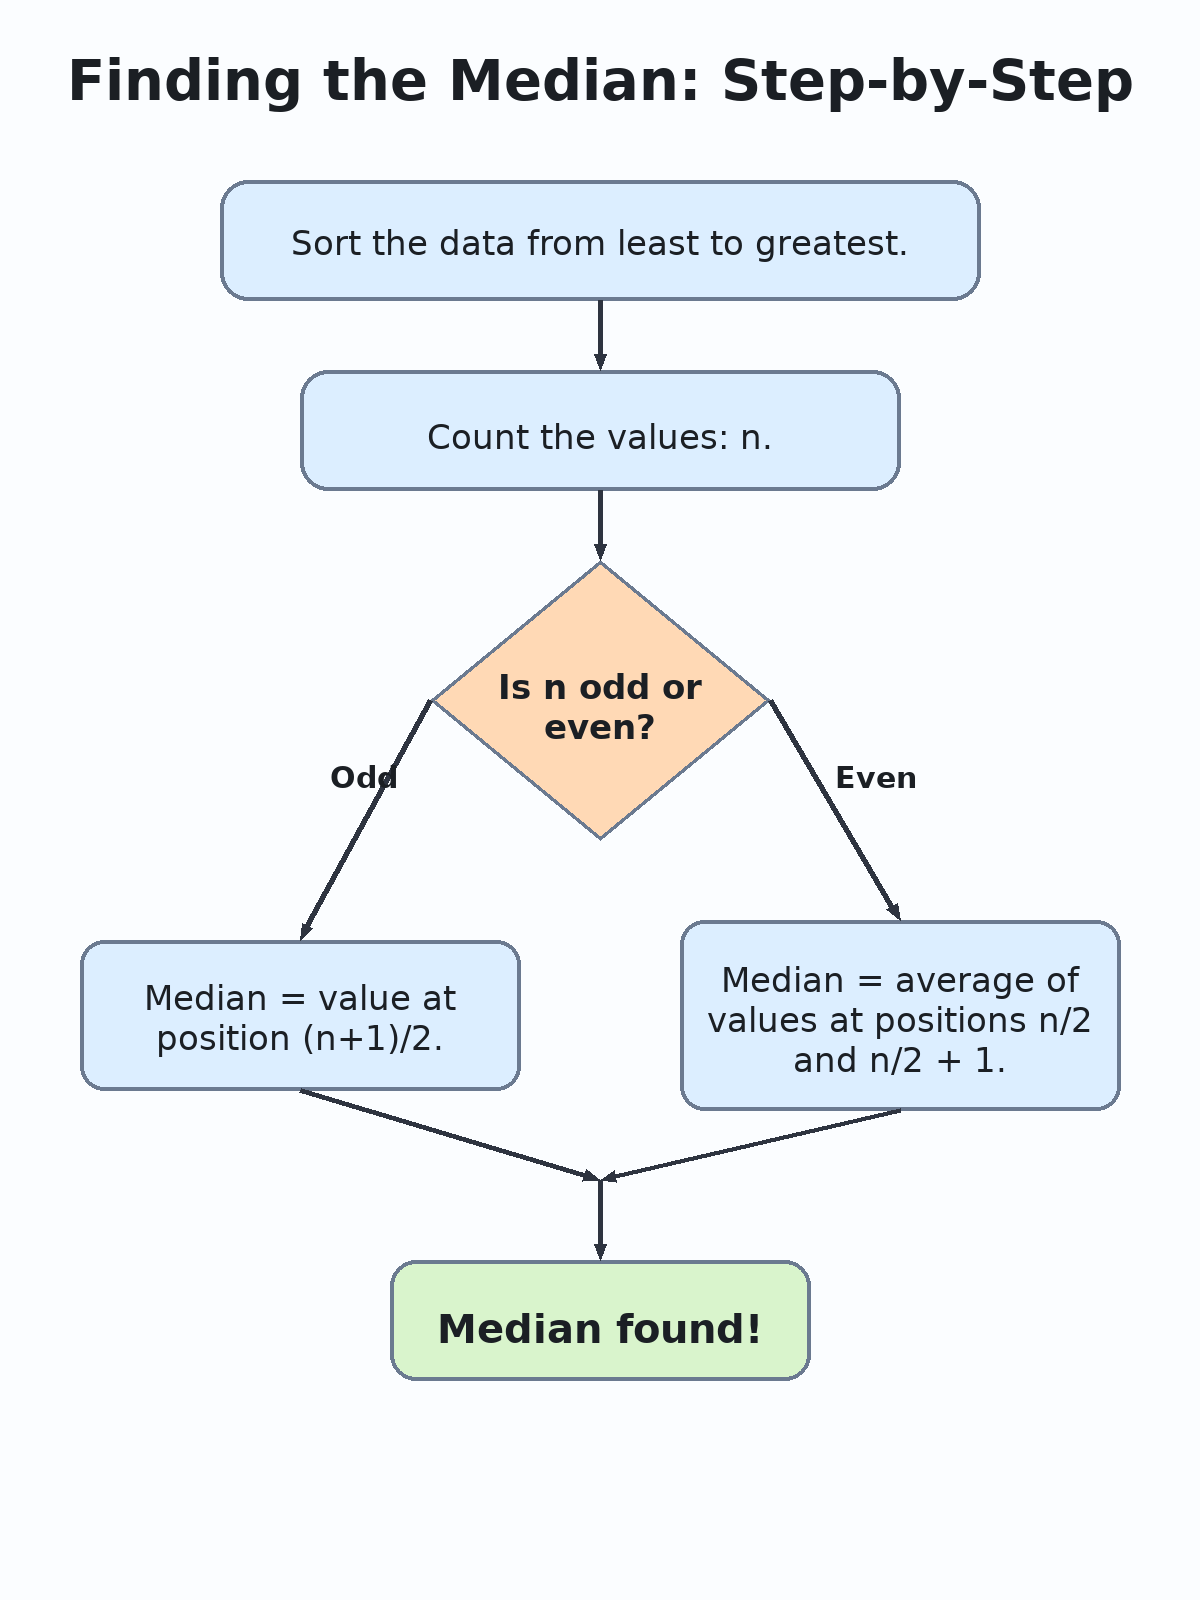
To bring everything together, here is the full process for finding the median:
- Sort the data from least to greatest.
- Count the number of values, .
- If is odd: the median is the value at position .
Before you jump into practice, here are a few points worth keeping in mind:
- Always sort first. The most common mistake is skipping the sorting step and picking the middle entry from the original, unordered list. The result will almost certainly be wrong.
- The median can be a decimal even when all data values are whole numbers. As we saw with the study-hours example, averaging two whole numbers can produce a result like .
- The median is not affected by how extreme the outer values are. If the highest study time were instead of , the two middle values would still be and , and the median would remain . Recall that every value influences the mean; the median, by contrast, only cares about position.
In this lesson, we learned how to calculate the median by first ordering the data and then locating the middle value. When the dataset has an odd number of entries, the median is the single center value. When it has an even number, we average the two entries closest to the center. This positional approach gives us a measure of center that complements the mean we studied in the previous lesson.
Now it is time to put these steps into practice! Up next, you will work through a set of hands-on tasks — from guided fill-in-the-blank examples to real-world scenarios like daily step counts, rental prices, and home sale prices. Jump in and see how quickly the process becomes second nature!