Welcome back to Data Distributions and Center! You are now on lesson two of six in this course, and you are making great progress. In the previous lesson, we explored what a data distribution is and how to describe the overall pattern of a dataset by observing where values cluster, how far they spread, and whether any values stand apart. Now it is time to take the next step: calculating a single number that summarizes the center of a distribution. That number is the mean, and it is one of the most widely used tools in all of data analysis.
Describing a distribution gives us a rich picture of our data, but sometimes we need a quick, simple summary. Imagine a friend asks, "How much do you usually spend on lunch?" They are not expecting a full breakdown of every meal — they want one number that captures the general idea.
This is exactly what a measure of center does. It condenses an entire dataset into a single representative value. The arithmetic mean, often just called the mean or average, is the most common way to do this. Let's see how it works.
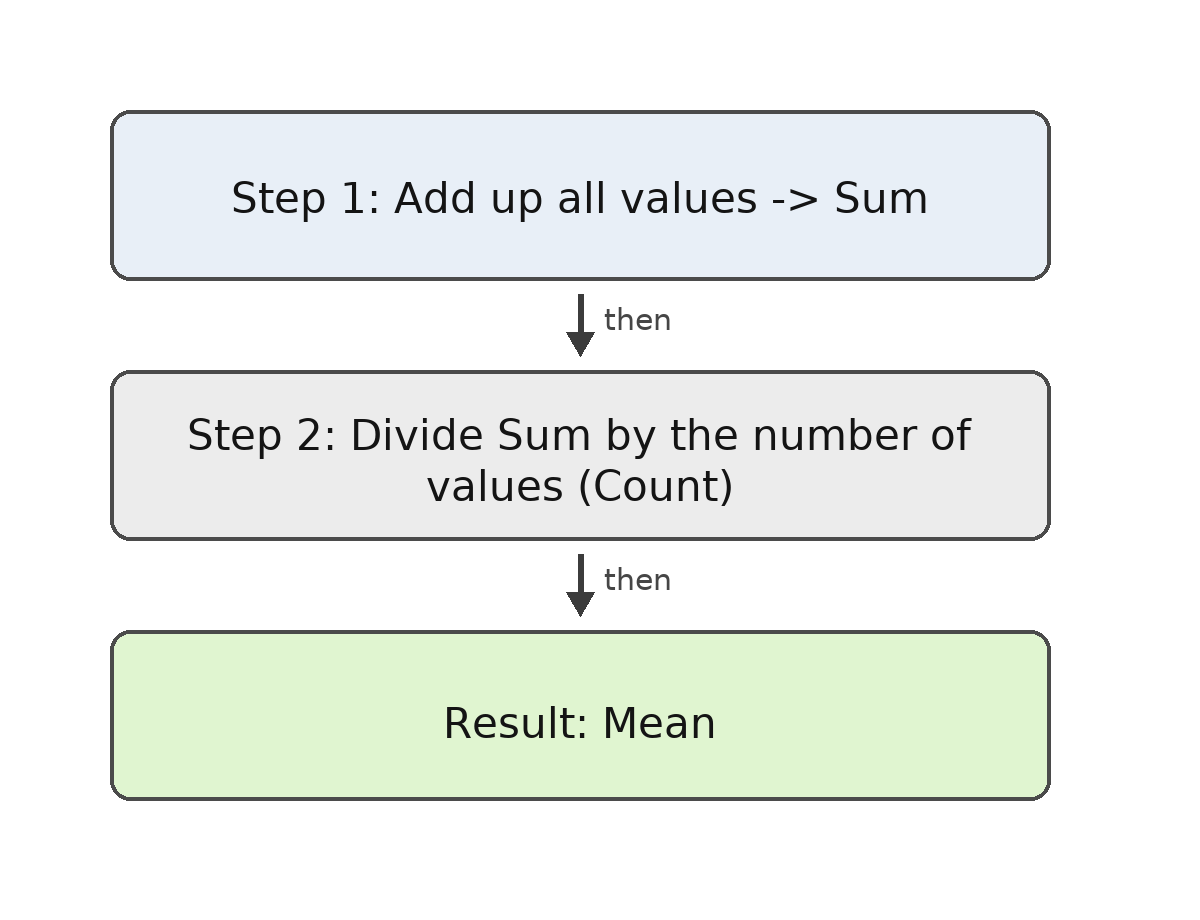
Computing the mean involves two straightforward steps:
- Add up all the values in the dataset to get the sum.
- Divide that sum by the count (the number of values).
We can write this as a formula:
That is the entire procedure. Every value in the dataset contributes to the sum, which means every value has a direct effect on the result. This is an important property we will return to shortly.
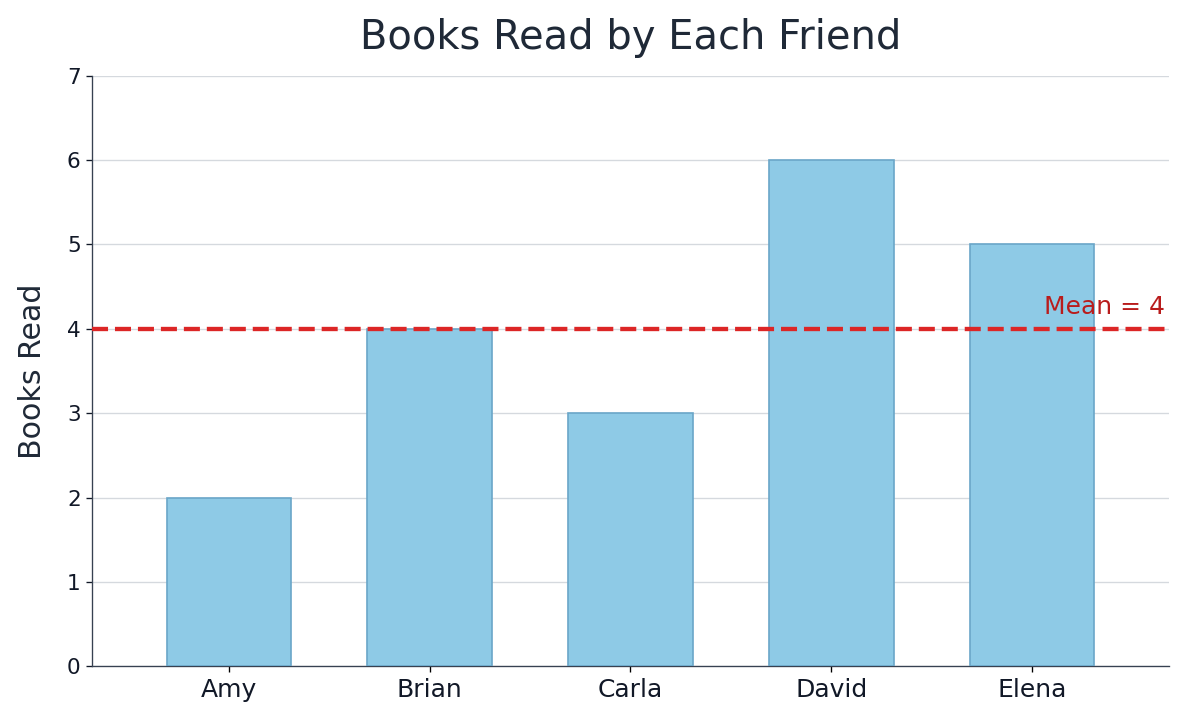
Let's walk through a complete calculation. Suppose we recorded the number of books five friends read last month:
Step 1 — Find the sum:
Step 2 — Divide by the count: There are values, so:
One of the most intuitive ways to think about the mean is as a fair share. Imagine the five friends above pooled all books together and then split them equally. Each person would get books. The mean answers the question: "If everyone got an equal portion, how much would each person receive?"
This idea shows up naturally in everyday life. When a group of coworkers splits a lunch bill evenly, the amount each person pays is the mean of the individual meal costs. When a teacher divides classroom supplies equally among students, each student's share is the mean. Whenever you hear someone say "on average," they are often describing exactly this kind of equal redistribution.
There is another helpful way to picture the mean: as a balance point. Imagine placing each data value along a number line, like weights on a seesaw. The mean is the point where the seesaw would balance perfectly.
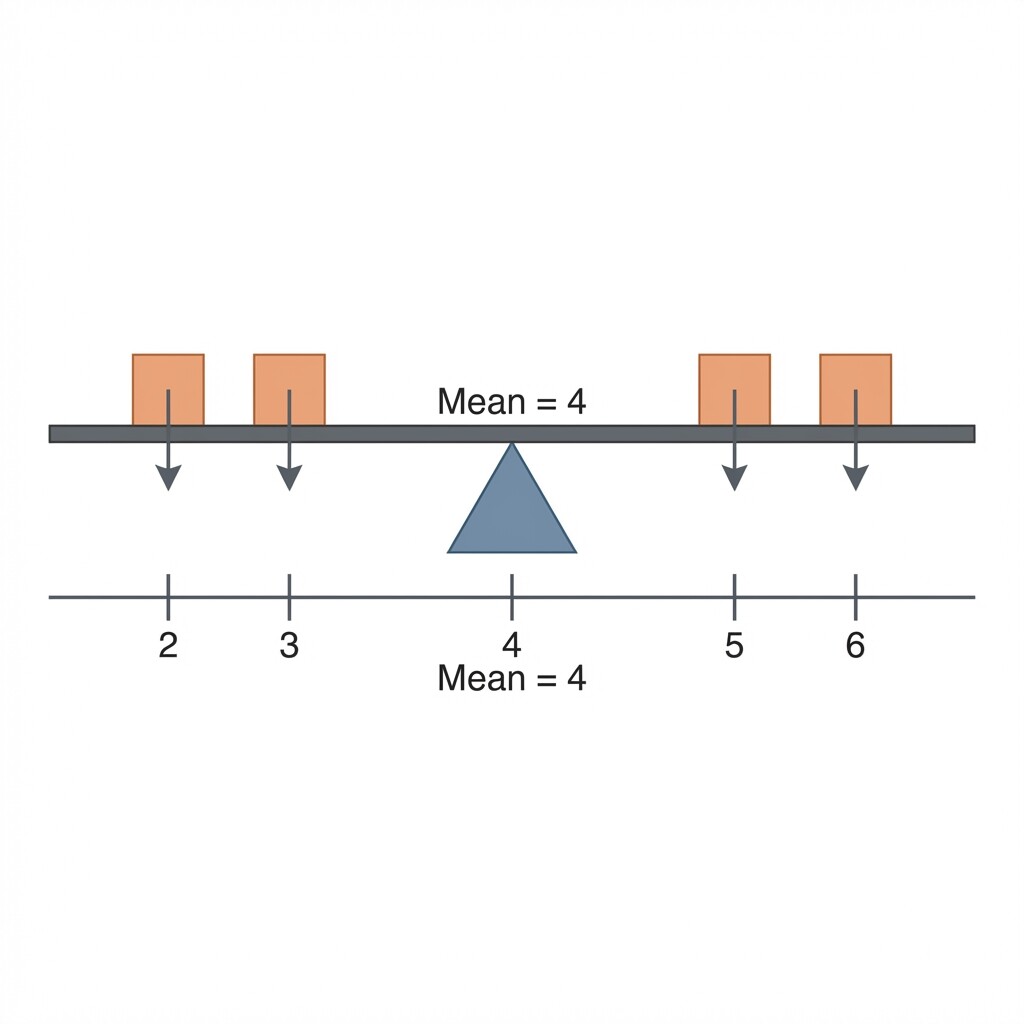
Using our books example, the five values are and the mean is . The values below the mean ( and ) pull downward by a combined distance of . The values above the mean ( and ) pull upward by . The pulls in each direction are equal, so the data balances at .
Before we wrap up, here are a few practical points to keep in mind when calculating and interpreting the mean:
- The mean does not have to be a whole number. A mean of books is perfectly valid, even though no one actually read books.
- The mean does not have to equal any value in the dataset. It is a summary, not necessarily one of the original data points.
- Order does not matter. Because we are just adding values, we can list them in any order and get the same sum.
- The mean is not always the "most common" or "most typical" value. It is a calculated balance point, not the value that occurs most often. In some datasets, no one actually has a value close to the mean, so other measures of center — which we will meet in the next lesson — may describe a typical observation more directly.
These small details can save confusion, especially when a result looks unexpected at first glance.
In this lesson, we learned how to calculate the mean by summing all values in a dataset and dividing by the count. We also explored two powerful ways to interpret the result: as a fair share (equal redistribution) and as a balance point (the spot where all values even out). The key takeaway is that the mean uses every value, so each data point directly influences the final number.
Up next, you will put these skills into action with a set of practice tasks that walk you through real-world scenarios — from splitting bills to analyzing commute times. It is your chance to build confidence with the calculation and deepen your understanding of what the mean really tells us, so let's get started!