Welcome back to Compound Event Probability! You are now on lesson three of five in this course, so you have passed the halfway mark. In the first two lessons, we explored what makes compound events different from simple events and then learned the fix-and-cycle technique for building organized lists of every outcome pair. That approach is reliable, but today we introduce a tool that makes the same job faster and more visual: the two-way table. By the end of this lesson, you will be able to set up a two-way table for any two-stage event, read outcome pairs directly from its grid, and use it to find probabilities with confidence.
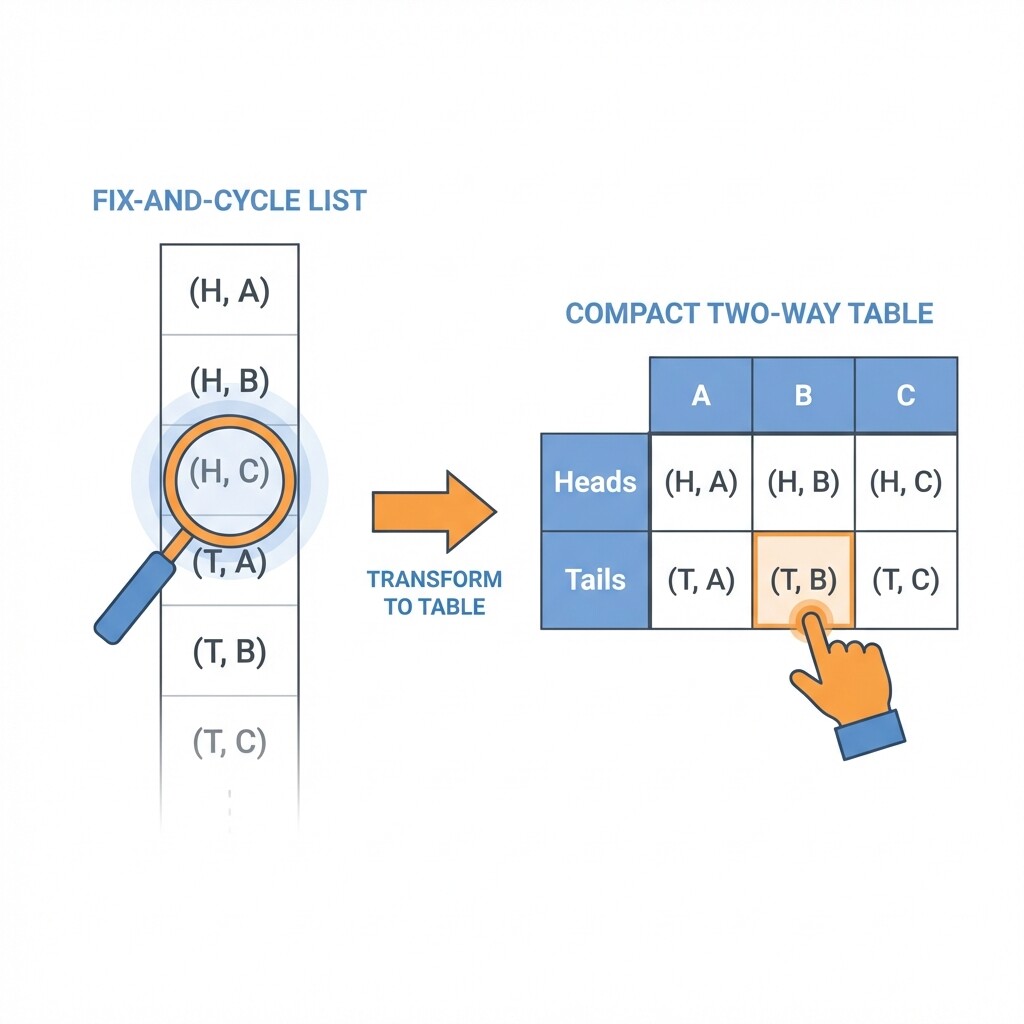
The fix-and-cycle list captures every outcome pair in a single column. It works well, but as the number of options in each stage grows, that column gets long and harder to scan. A two-way table arranges the same information in a compact grid. One stage runs along the top as column headers, and the other stage runs down the side as row headers. Each cell where a row meets a column holds exactly one outcome pair.
This layout brings a practical advantage: instead of reading line by line through a long list, you can jump to the right row or column and pick out what you need almost instantly. That speed matters when you are identifying favorable outcomes for a probability question.
Let's build a two-way table from scratch. Suppose we flip a coin (Heads or Tails) and then spin a spinner with three equal sections labeled A, B, and C. Here is the process:
- Choose which stage goes where. We will place the coin results along the rows and the spinner results along the columns.
- Draw the grid. Create one row for each Stage 1 option and one column for each Stage 2 option.
- Fill every cell. Write the pair formed by combining the row label with the column label.
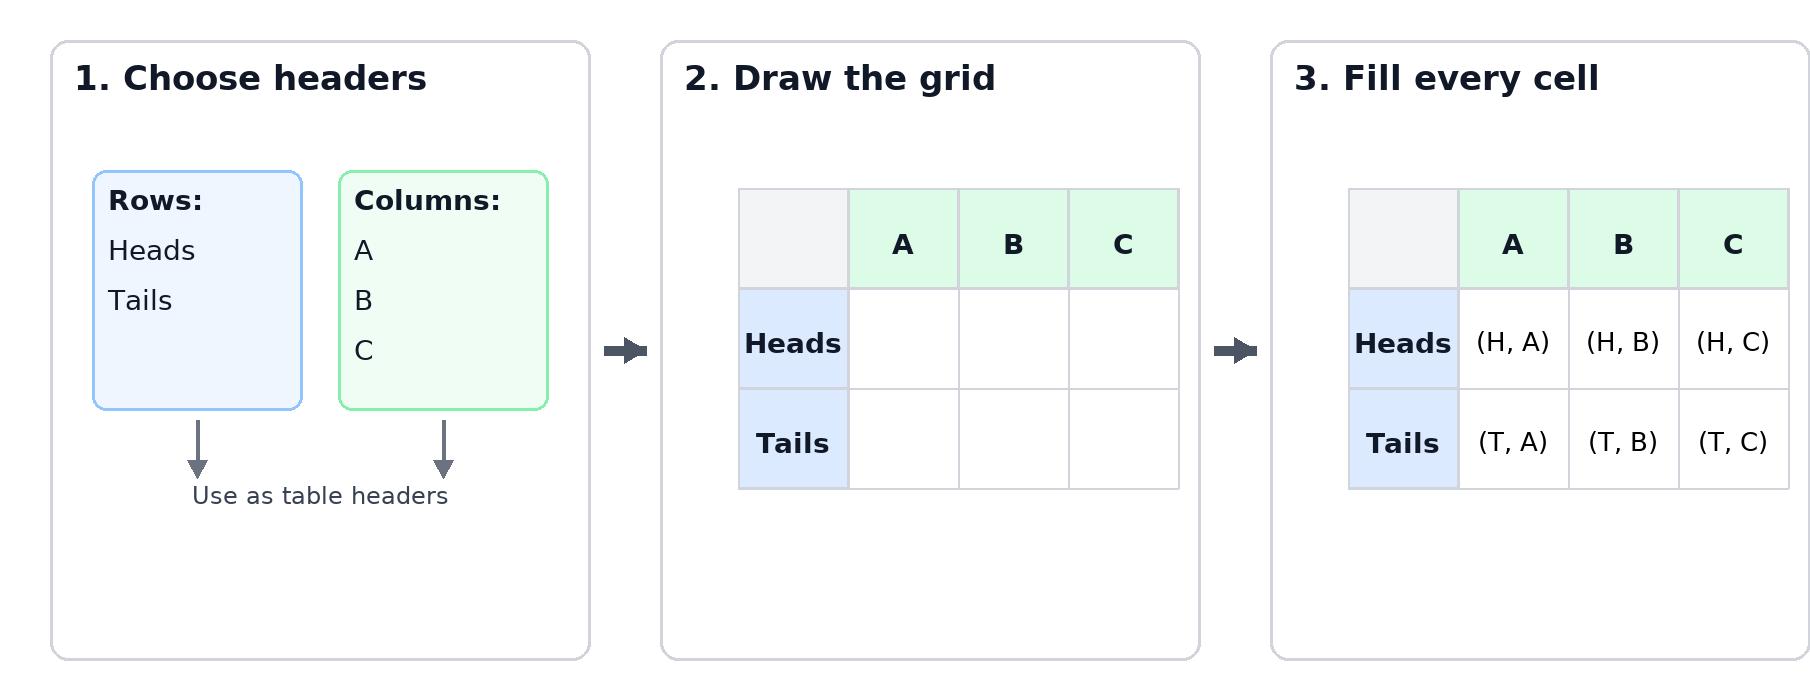
The grid has rows and columns, giving us cells. That matches the total the multiplication rule predicts, so we know the table is complete.
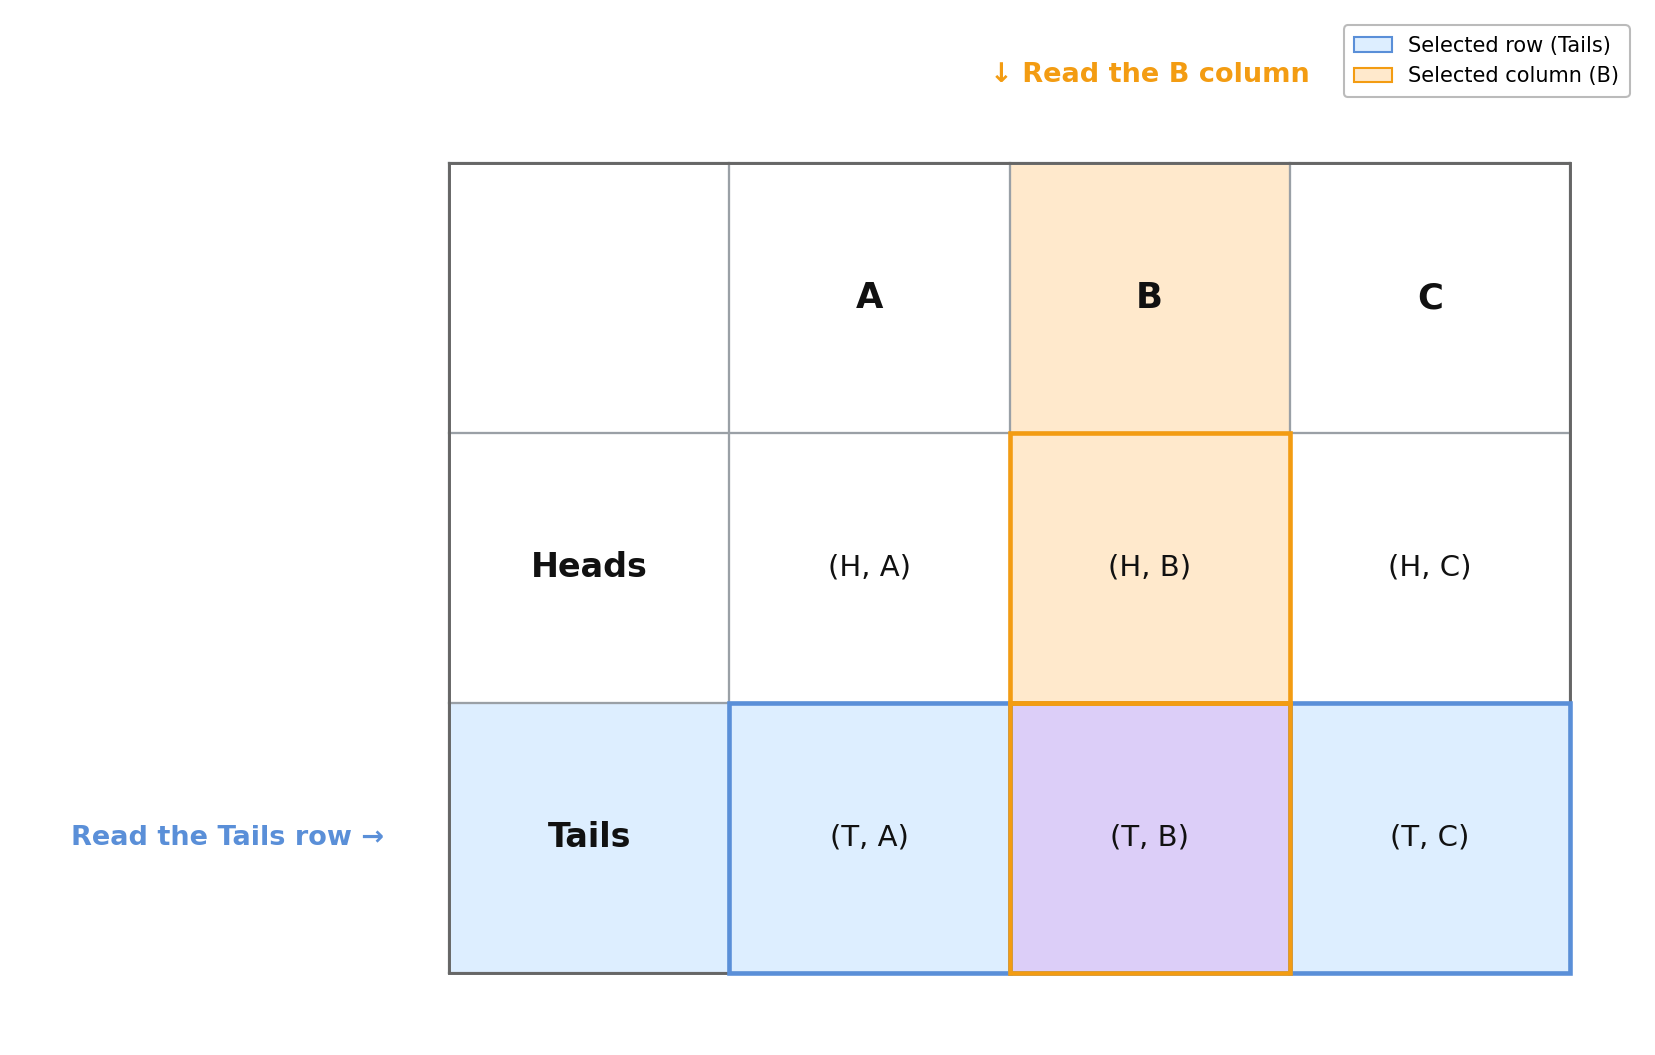
One of the biggest benefits of a two-way table is how quickly you can locate outcomes. Need every pair that includes Tails? Simply read across the Tails row: (T, A), (T, B), (T, C). Want every pair with spinner result B? Read down the B column: (H, B), (T, B).
This row-and-column structure is what makes tables especially handy for finding favorable outcomes. Instead of scanning a long list from top to bottom, you zero in on the relevant row, column, or single cell and count what you need in seconds. Thinking of it another way, every row represents a "slice" of outcomes sharing one Stage 1 result, and every column represents a "slice" sharing one Stage 2 result — so the table is pre-sorted in two directions at once.
Once the table is complete, finding a probability follows the same familiar formula:
Let's try it. Using our coin-and-spinner table, suppose we want the probability of getting Heads and a vowel (the only vowel on the spinner is A). We look at the Heads row and the A column. The cell at their intersection is (H, A). That gives us favorable outcome out of total:
Let's apply the table method to an everyday situation. A café offers three cup sizes (Small, Medium, Large) and four flavor add-ins (Vanilla, Caramel, Hazelnut, Mocha). You ask a friend to surprise you with a random combination. What is the probability that you end up with a Medium cup in either Vanilla or Mocha?
Step 1 — Build the table. Sizes go on the rows; flavors go on the columns.
The table has cells, confirming equally likely outcomes.
We need combined with . Scanning the Medium row, the cells under Vanilla and Mocha are (M, Van) and (M, Moc). That is favorable outcomes.
Here are a few pointers to keep in mind as you work with this method:
- Either stage can go on the rows or columns. The math works the same no matter which way you arrange the grid. Pick whichever layout feels more natural to read.
- Always verify the cell count. Multiply the number of rows by the number of columns and confirm it matches the product from the multiplication rule. If it does not, a row or column was likely left out.
- Use shorthand in cells. Writing (M, Van) instead of (Medium, Vanilla) keeps the table compact and easy to scan, especially when the grid is large.
In this lesson, we moved from organized lists to two-way tables — a grid that displays every outcome pair of a two-stage compound event at the intersection of a row and a column. We learned how to construct the table, read individual cells or entire rows and columns, and use the grid to identify favorable outcomes and calculate probabilities.
Now it is your turn to put the grid to work. In the upcoming practice exercises, you will complete partially filled tables, scan grids for favorable outcomes, and calculate probabilities in real-world contexts like choosing work outfits and picking meal deals. Dive in and see how naturally this method clicks!
