Welcome back to Compound Event Probability! You are now on lesson four of five, which means the finish line for this course is within reach. So far, we have built a solid toolkit for working with compound events: we started by understanding what compound events are, then practiced organized lists with the fix-and-cycle technique, and most recently used two-way tables to display outcome pairs in a compact grid.
Each tool has served us well, but they share one limitation: they work most naturally with two-stage events. Today we introduce the tree diagram, a flexible visual tool that handles two stages just as comfortably as three, four, or more. By the end of this lesson, you will be able to construct a tree diagram, trace every outcome path through it, and use those paths to calculate probabilities for multi-stage compound events.
Two-way tables organize outcomes into rows and columns, which is perfect when there are exactly two stages. But what happens when a third stage enters the picture? A table would need a third dimension, and drawing a 3-D grid on paper is not very practical.
Tree diagrams solve this problem by growing outward rather than filling a grid. Each stage adds a new set of branches, so whether the event has two stages or five, the diagram simply extends to the right. This makes tree diagrams the go-to tool when compound events involve more than two stages.
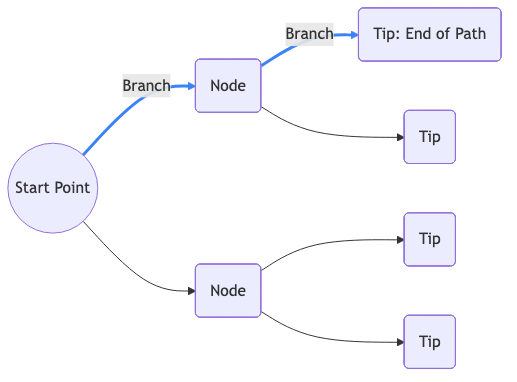
A tree diagram starts with a single point on the left. From that point, branches spread out for each option in Stage 1. At the tip of every Stage 1 branch, a new set of branches fans out for each option in Stage 2, and so on for every additional stage. The key vocabulary is straightforward:
- Branch: a line segment representing one option at a particular stage.
- Node: a point where branches meet or split.
- Path: a route from the very first point all the way to a tip on the far right, passing through exactly one branch per stage.
Each complete path corresponds to one combined outcome of the compound event. Reading the labels along a path, from left to right, tells you which option was chosen at every stage.
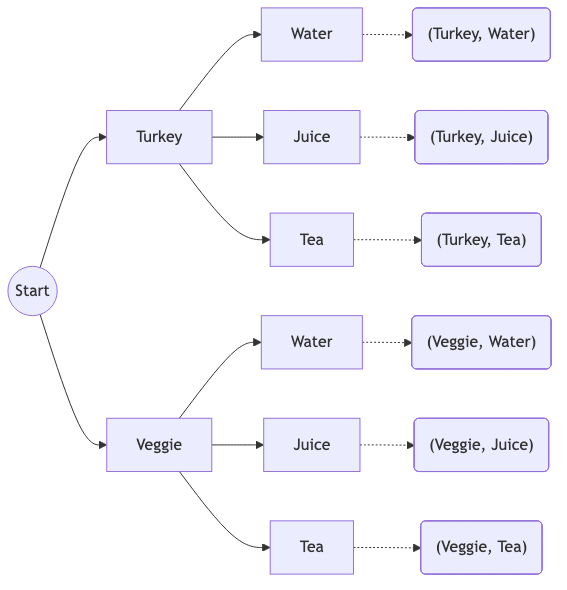
Let's construct a tree diagram step by step. Imagine you are choosing a sandwich (Turkey or Veggie) and then a drink (Water, Juice, or Tea) for lunch.
Stage 1 — Sandwich. Draw two branches from the starting point, one labeled Turkey and one labeled Veggie.
Stage 2 — Drink. From the tip of each Stage 1 branch, draw three branches labeled Water, Juice, and Tea.
The finished diagram has tips, and each tip sits at the end of a unique path. For example, following the Turkey branch and then the Juice branch gives the outcome (Turkey, Juice). Following the Veggie branch and then the Tea branch gives (Veggie, Tea). Every path captures one outcome pair, just as a cell in a two-way table does.
Notice the total number of paths matches the multiplication rule: . If the count does not match, a branch is probably missing.
Reading a tree diagram is like following a map. Start at the leftmost point, pick one branch per stage, and move to the right until you reach a tip. The labels you collect along the way form the combined outcome for that path.
To list all outcomes, trace every possible route from start to finish. A helpful habit is to work top to bottom: follow the topmost branch at Stage 1, then trace each Stage 2 branch beneath it before moving down to the next Stage 1 branch. This systematic sweep ensures nothing is skipped or repeated, much like the fix-and-cycle technique you practiced with organized lists.
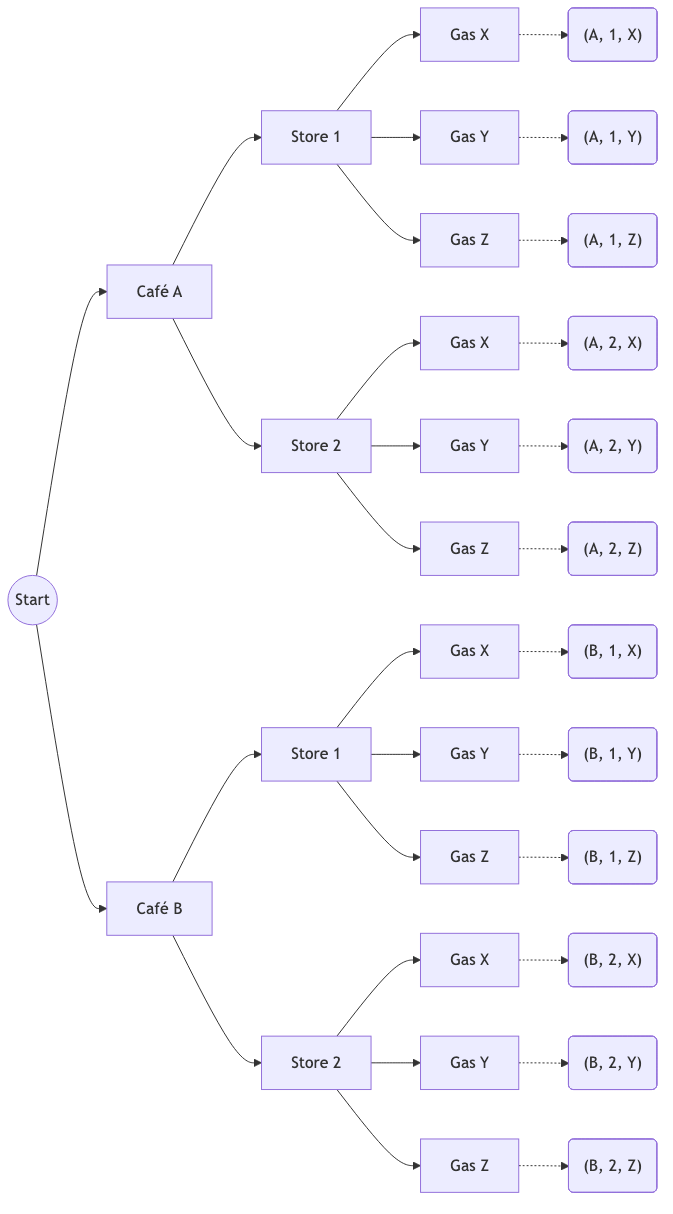
Here is where tree diagrams truly shine. Suppose you are planning a Saturday morning with three stops: a coffee shop (Café A or Café B), a grocery store (Store 1 or Store 2), and a gas station (Gas X, Gas Y, or Gas Z).
Stage 1 gives branches, Stage 2 adds branches to each Stage 1 tip, and Stage 3 adds branches to each Stage 2 tip. The total number of paths is:
Once all paths are drawn, calculating probability follows the same formula we have used throughout this course:
Let's return to the sandwich-and-drink example. Suppose every option at each stage is equally likely. What is the probability that you end up with a Veggie sandwich and either Water or Tea?
- Total paths: (we counted them earlier).
Let's look at a slightly richer scenario. You commute in two legs. For the first leg, you can take a Bus or the Subway. For the second leg, you can Walk, Bike, or take a Rideshare.
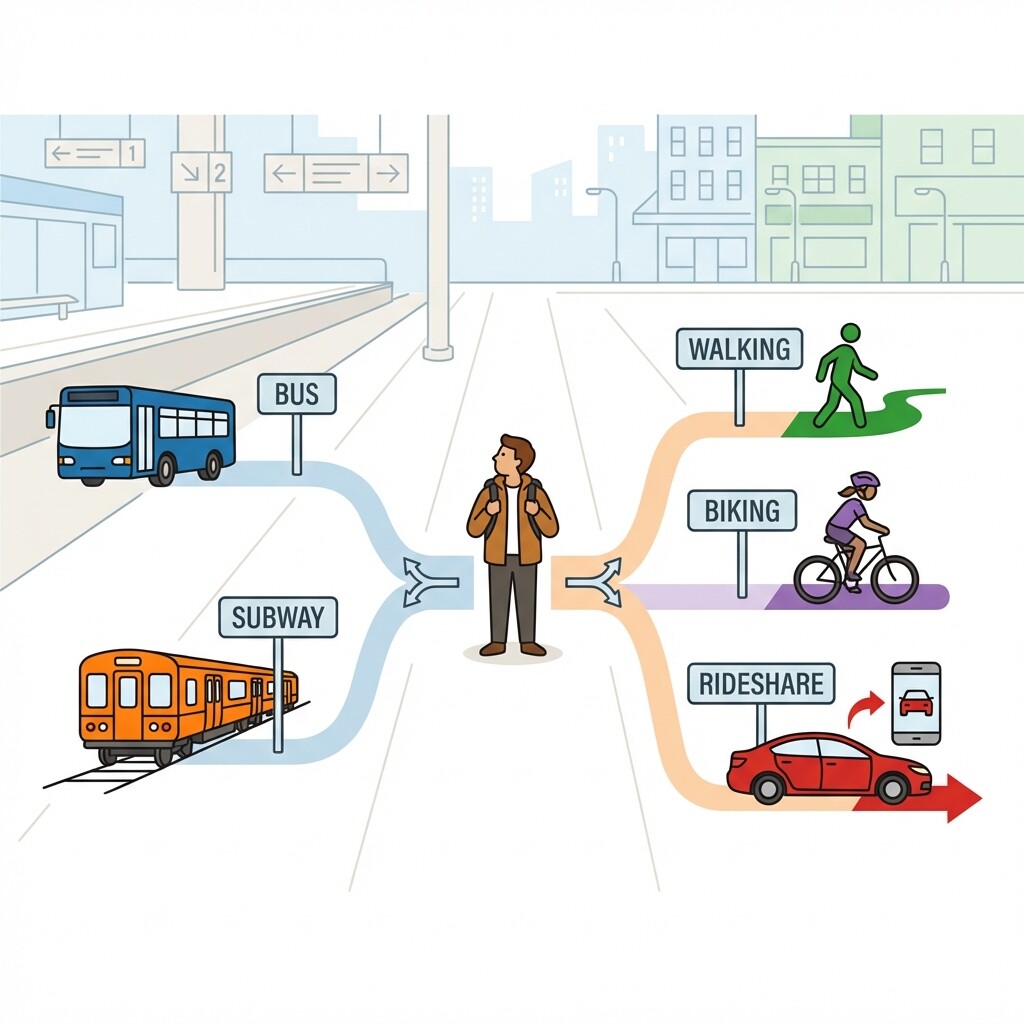
Building the tree gives paths. Suppose we want the probability that at least one leg involves a non-motorized option (Bus, Subway, and Rideshare are motorized; Walk and Bike are non-motorized). We scan each path and label it:
Four out of six paths include at least one non-motorized option:
A few pointers will help you build clean, accurate tree diagrams every time:
- Keep labels short. Use abbreviations like T for Turkey or W for Water so the diagram stays readable as it grows.
- Verify path count with multiplication. Multiply the number of branches at each stage. If the product does not match your count of tips, revisit the diagram for a missing or extra branch.
- Work left to right, trace top to bottom. Drawing stages from left to right mirrors the order events happen. When listing outcomes, sweeping top to bottom at each stage keeps you organized and prevents duplicates.
In this lesson, we added the tree diagram to our compound-event toolkit. We learned that each stage creates a new layer of branches, that every path from start to tip represents one combined outcome, and that the total number of paths equals the product of the options at each stage. Most importantly, we saw that tree diagrams extend naturally to three or more stages — something that lists and tables handle less gracefully.
Now it is time to put these branching skills into action. The practice exercises ahead will have you reading completed tree diagrams, filling in missing branches, tracing paths through multi-stage scenarios, and calculating probabilities on your own. Jump in and see how each branch leads you to the answer!