So far in Building Probability Models, you have learned to define valid probability models, construct both uniform and non-uniform versions, and compute event probabilities. That is a powerful toolkit, and you are now on lesson four of five, which means only one lesson remains after this one.
But here is a question those earlier skills leave unanswered: if you know the probability of an event, how many times should you actually expect it to happen? In this lesson, we bridge the gap between a probability on paper and a concrete prediction you can act on. By the end, you will be able to take any probability model and forecast the expected number of times each outcome will occur over a given number of trials. This is where probability becomes genuinely practical — it lets us set expectations, plan resources, and make informed decisions.
Be a part of our community of 1M+ users who develop and demonstrate their skills on CodeSignal
Knowing that an event has a probability of 0.25 is useful, but a business owner or project planner usually needs a more concrete answer. They want to know how many times something is likely to happen. For example, if a coffee shop expects 200 customers tomorrow and the probability of someone ordering a latte is 0.25, the shop would like to know roughly how many lattes to prepare for.
This is where expected frequency comes in. It translates a probability into a count by connecting the model to a specific number of upcoming trials. The logic is straightforward: if an event should happen 25% of the time, then over 200 trials we would expect it to happen about 25% of 200 times.
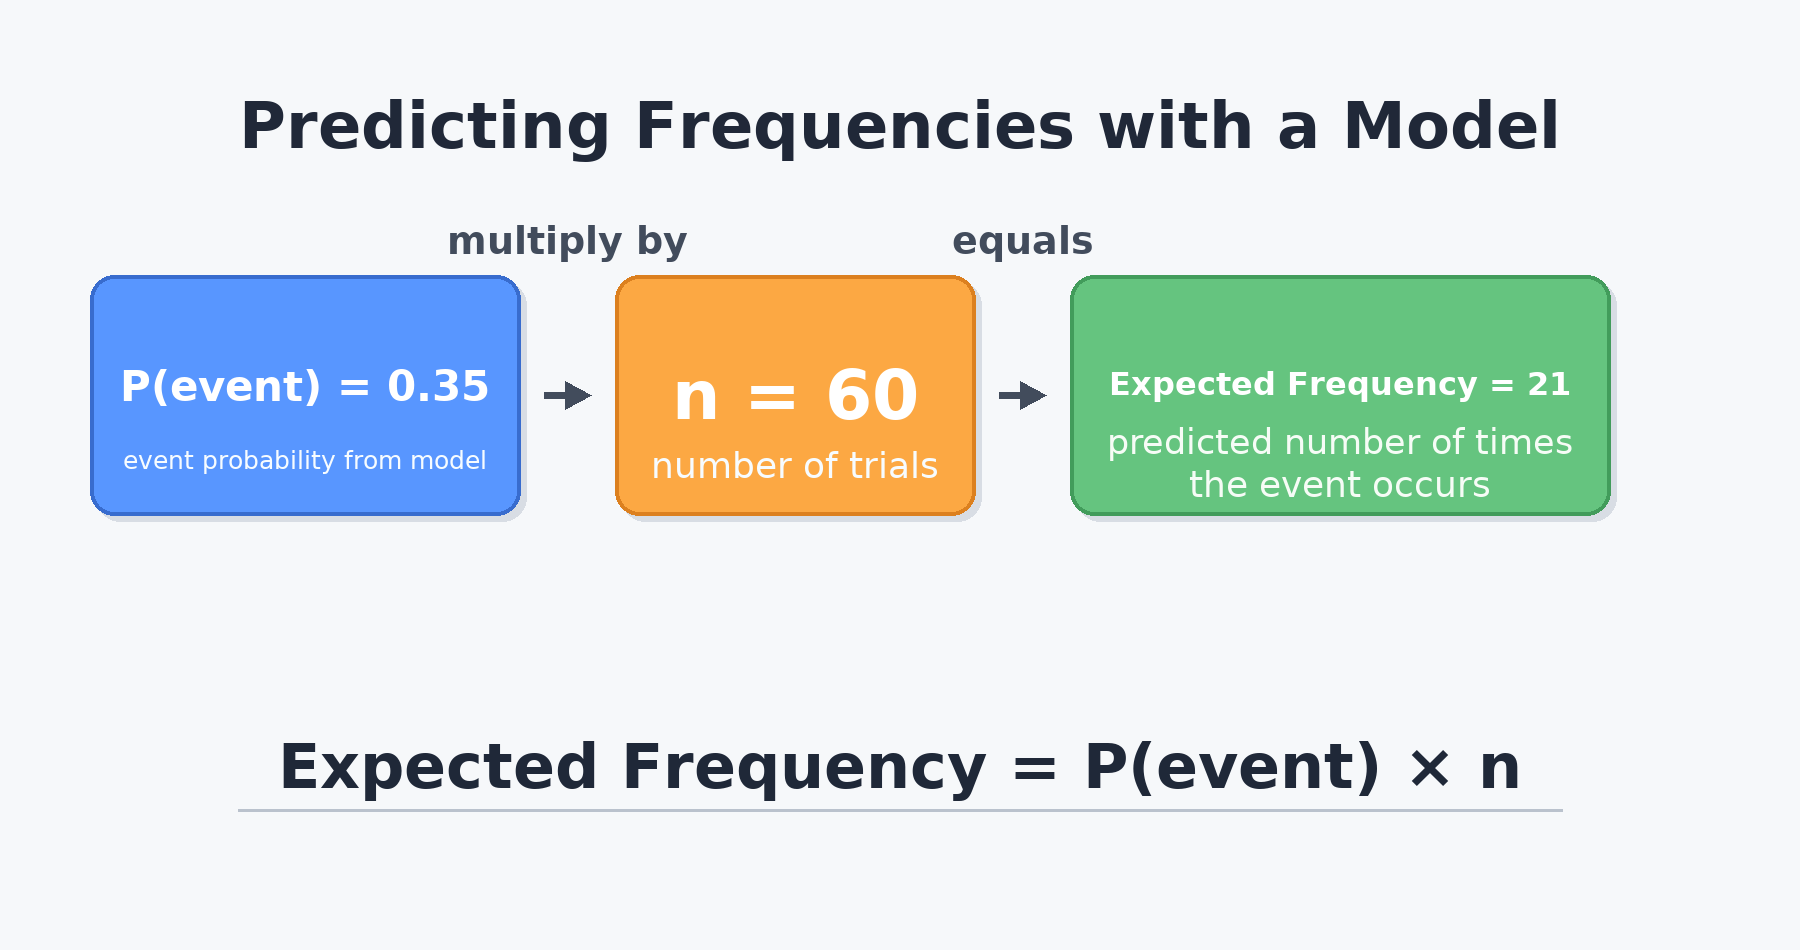
To predict how often an event will occur, multiply the event's model-assigned probability by the total number of trials:
Expected Frequency=P(event)×n
Here, P(event) is the probability from our model, and n is the number of trials we plan to observe or carry out. The result tells us how many times we expect the event to occur.
Let us try a quick example. Suppose a probability model for a spinner gives P(green)=0.35. If we spin 60 times, the expected frequency of green is:
Expected Frequency=0.35×60=21
We would expect to land on green about 21 times out of 60 spins. That single multiplication is the entire method.
Let us walk through a fuller scenario. A delivery service built the following non-uniform probability model from its records:
Outcome
Probability
On Time
0.80
Late
0.15
Missed
0.05
As you practiced in previous lessons, we can quickly confirm this is a valid model: every value is between 0 and 1, and 0.80+0.15+0.05=1.00. Now suppose the company expects 400 deliveries next month. How many do we expect to be late?
We apply the prediction formula:
Expected Late Deliveries=P(late)×n=0.15×400=60
Out of 400 deliveries, the model predicts about 60 late deliveries. This kind of prediction helps the company plan staffing, set customer expectations, or decide whether to invest in improving its on-time rate.
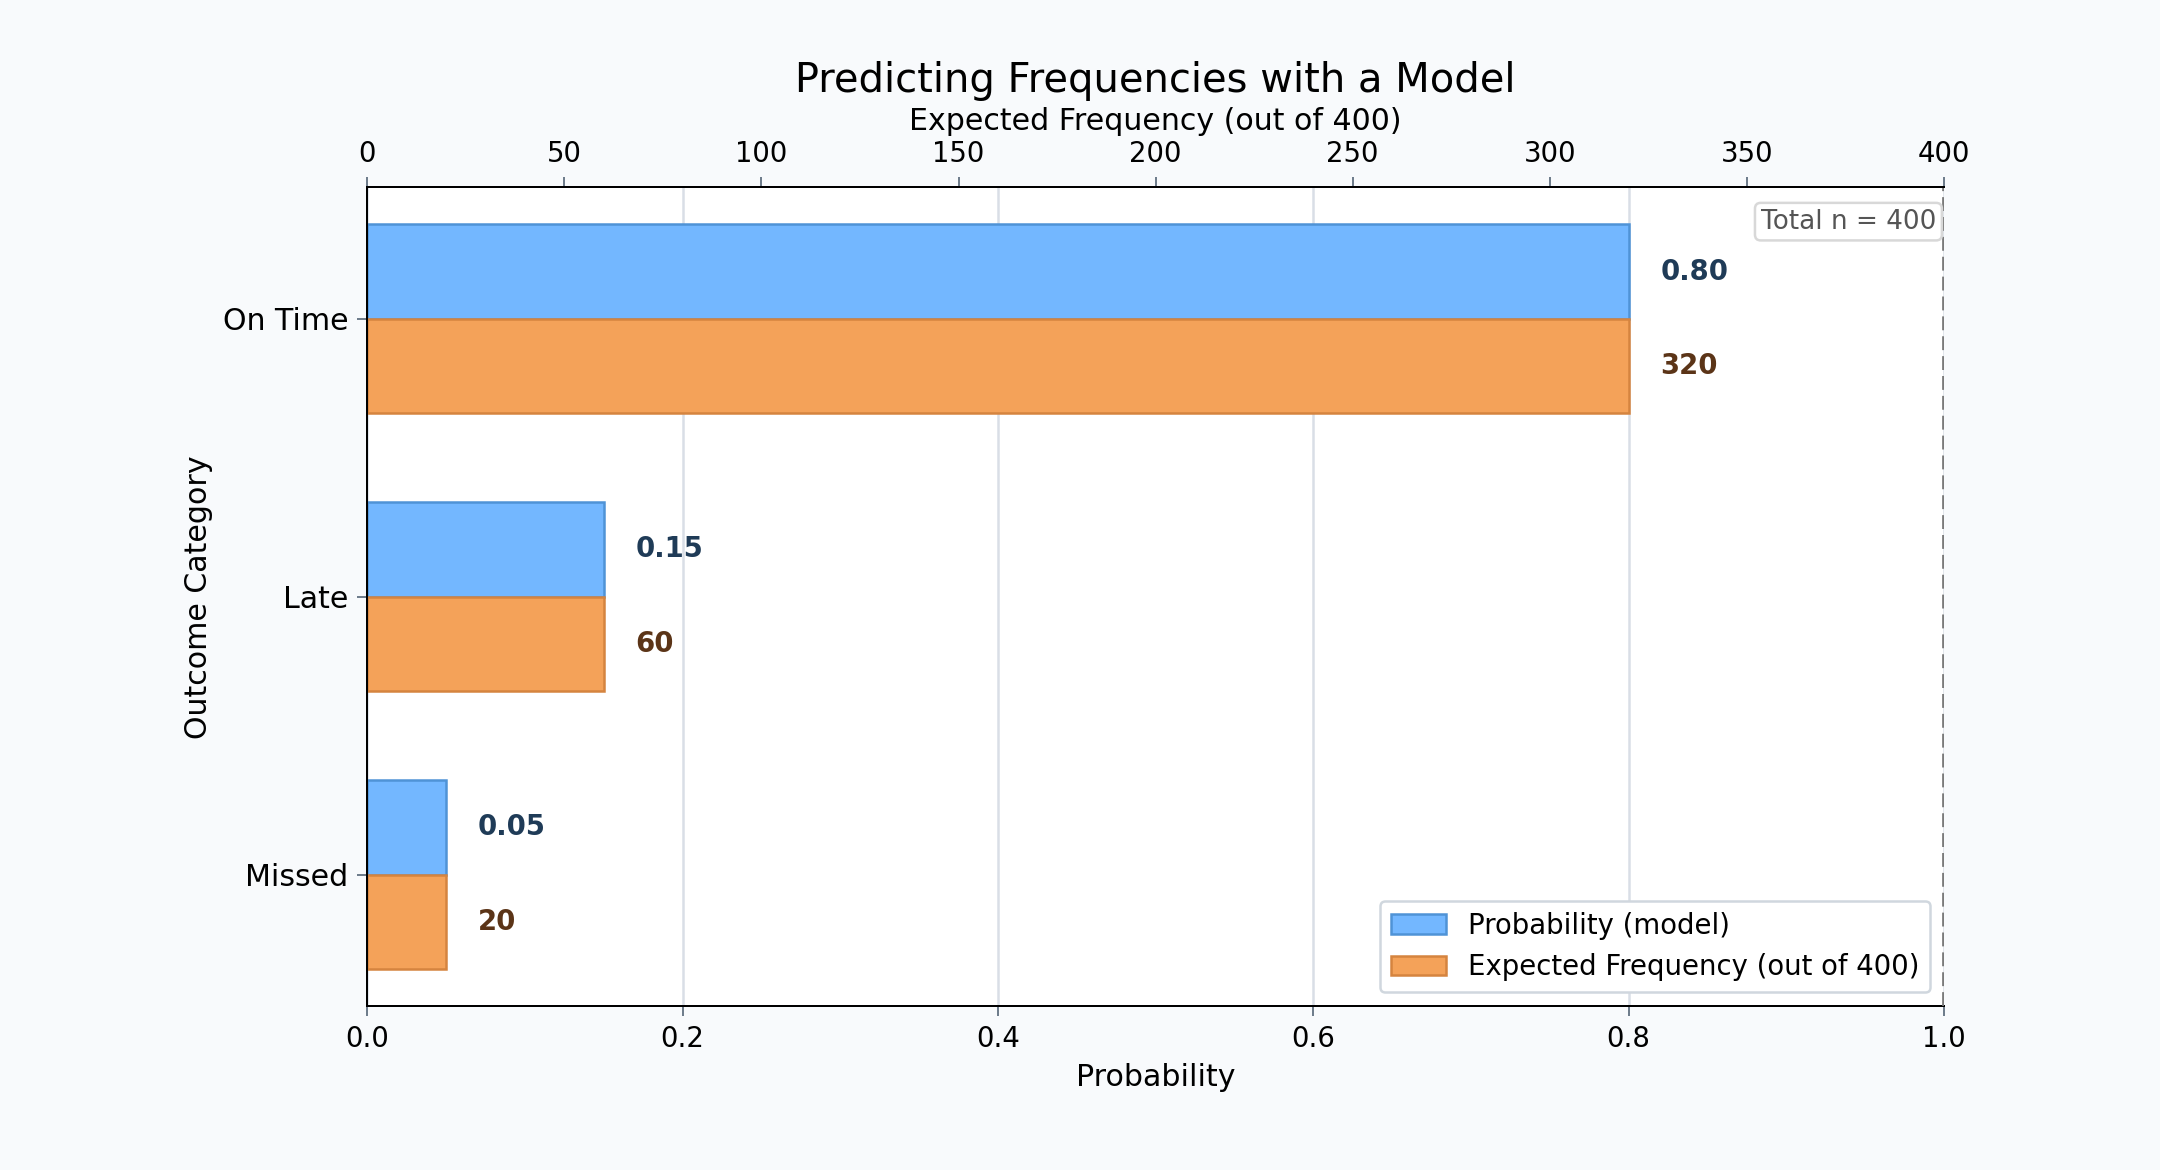
One powerful feature of this method is that we can predict the expected frequency for each outcome in the model, not just one. Let us return to the delivery example with n=400 and compute all three:
Outcome
Probability
Expected Frequency
On Time
0.80
0.80×400=320
Late
0.15
0.15×400=60
Missed
0.05
0.05×400=20
Notice that the expected frequencies add up to 320+60+20=400, which equals n. This will always happen when the model is valid, up to rounding, because the probabilities sum to 1. It serves as a handy self-check: if your predicted counts do not add up to the total number of trials, something went wrong in the calculation.
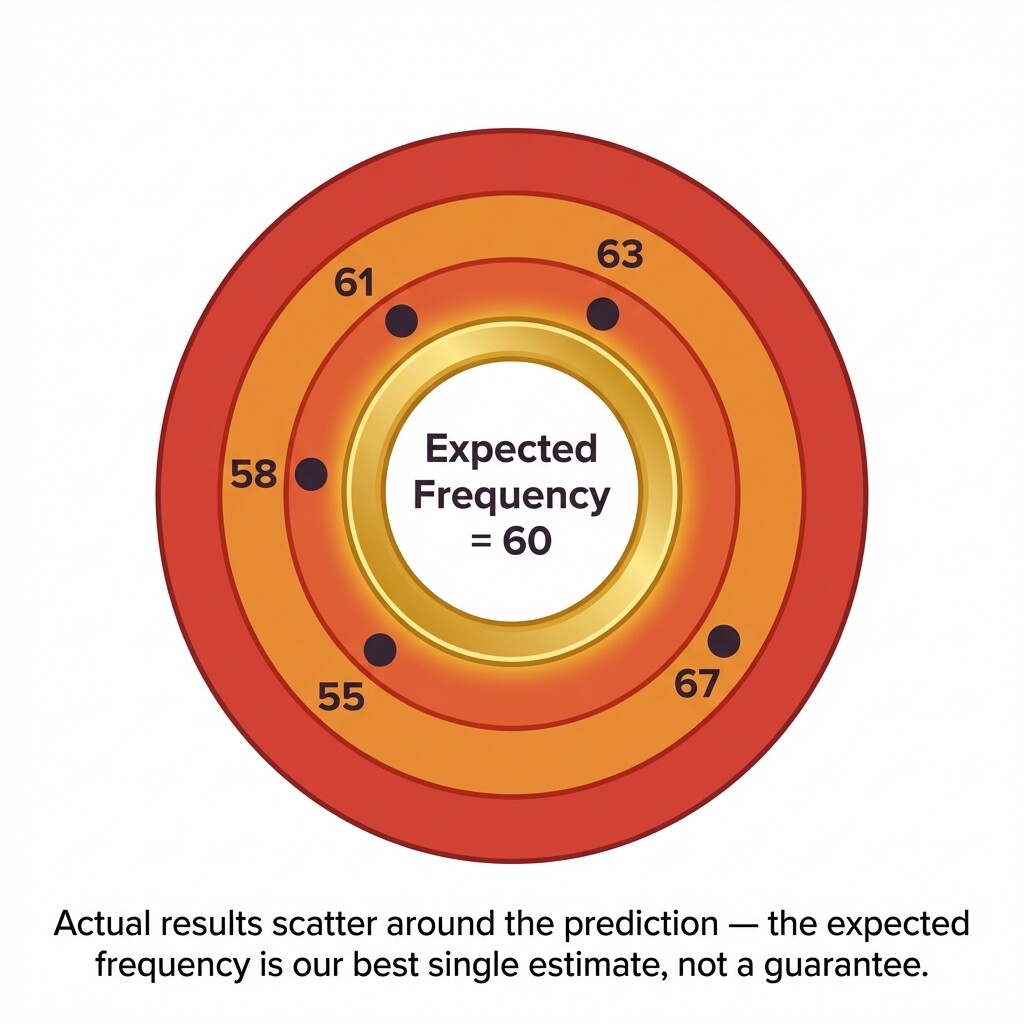
It is important to understand what "expected frequency" really means. It is the number we would anticipate based on the model, but it is not a promise. If the delivery company runs 400 deliveries, they might actually see 55 or 67 late ones instead of exactly 60, because random variation is always at play.
Think of expected frequency as the center of a target. Actual results will scatter around that center, sometimes a little above, sometimes a little below. Over a larger number of trials, the actual frequency tends to land closer to the prediction — an idea that connects back to the stabilization concept from earlier in this learning path. The model gives us the best single estimate, and that is extremely valuable for planning, even if reality never hits the number exactly on the nose.
In this lesson, you learned how to turn a probability model into a practical prediction tool. By multiplying an event's probability by the number of trials — Expected Frequency=P(event)×n — you get the expected frequency, a concrete estimate of how many times the event should occur. You can predict a single outcome's frequency or map out every outcome at once, and you can verify your work by confirming the predicted counts sum to n. The key takeaway is that these predictions are our best estimates, not exact guarantees.
Up next, you will put the prediction formula to work across several hands-on exercises. You will fill in the building blocks of the calculation, predict outcomes in real-world scenarios, and interpret full sets of predictions while explaining why actual results may differ slightly from what the model forecasts.