Unsupervised Learning with Clustering
Introduction
Welcome to the fascinating landscape of Unsupervised Learning and Clustering. In this course, we'll explore the popular k-Means clustering algorithm, a simple yet powerful form of clustering. Although clustering might seem technical, if you've ever sorted your clothes into piles based on their colors or types, you've unknowingly performed a form of "clustering" — grouping similar items into different categories or clusters. Intrigued? Let's get started!
Understanding Clustering
Supervised learning is like learning with a teacher. In this type of machine learning, you provide the computer with labeled data, which means the algorithm is given the input data and the correct answers. The aim is to find a model that makes the best predictions based on the given examples.
Unsupervised learning, on the other hand, is like learning on your own. In this type, the algorithm is given data but no specific directions about what it should be looking for. The computer is expected to explore the data and find its own patterns or structures. It is called unsupervised because there are no correct answers and no teacher.
Algorithms for unsupervised learning, like clustering, aim to group objects so that objects in the same group (a cluster) are more similar to each other than to those in other groups.
Consider an example: you have a list of fruits with their corresponding weights and volumes and want to group them into two groups, but you don’t know what the fruits are. You can perform clustering to segment the data into two clusters. Although we don’t know what the fruits are, we could predict that data points in the same cluster are the same type of fruit.
Given data for a new piece of fruit, you could attempt to classify which group it belongs to by seeing which cluster center it is closest to.
This lesson will focus on the widely used k-Means clustering method.
k-Means Clustering
The k-Means clustering algorithm aims to partition n observations into k clusters, where each observation belongs to the cluster with which it shares the most similarity. The steps involved are:
- Initialization: Random initialization of
kcentroids. - Assignment: Allocation of each data point to the closest centroid.
- Update: Updating each centroid by computing the mean of all points allocated to its cluster.
We repeat steps 2 and 3 until the centroids cease to change significantly. For now, we will manually set k, the number of clusters.
Implementing k-Means: Setup
Now, let's translate this algorithm into C++ code, using a dataset of 2D points for demonstration. We'll begin by defining our data structures and initializing our dataset.
First, we define a type for a 2D point and create a simple dataset. We also set the number of clusters, k, and initialize our cluster centroids by selecting two points from the dataset.
Next, we need a function to calculate the Euclidean distance between two points. The formula for Euclidean distance is:
for points and .
Implementing k-Means: Algorithm
Now, let's implement the k-Means algorithm in C++. The algorithm will repeatedly assign each data point to the nearest centroid and then update the centroids to be the mean of the points in their clusters until the centroids stabilize.
First, we need a function to compute the mean (center) of a cluster:
Now, let's put the k-Means algorithm together. Note that we use tuple as the return type, and you can use structured bindings (C++17 and above) to unpack the result:
In this function, we repeatedly assign each data point to the nearest centroid, then update each centroid to be the mean of its assigned points. The process repeats until the centroids do not move significantly (as measured by the tolerance parameter).
Implementing k-Means: Run and Visualize
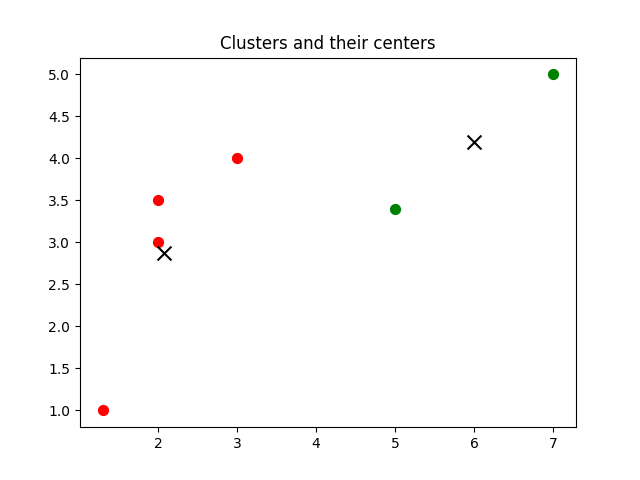
Now, let's run our k-Means clustering algorithm, print the results, and visualize the clusters and their centers using matplotlibcpp.
Sample Output:
This output consists of cluster centers and clusters. Cluster centers, or means, are centroids representing the central point of each cluster. Each point in our dataset is assigned to the cluster closest to it. The code also generates a plot of the clusters and their centers, saved as static/images/plot.png. While versatile, k-Means performs optimally when cluster densities are approximately equal.
Plot:
Lesson Summary and Practice
Congratulations on successfully navigating the core aspects of clustering and implementing the k-Means algorithm in C++! Moving forward, practice exercises are available to help solidify these concepts. I look forward to seeing you in the next lesson!
