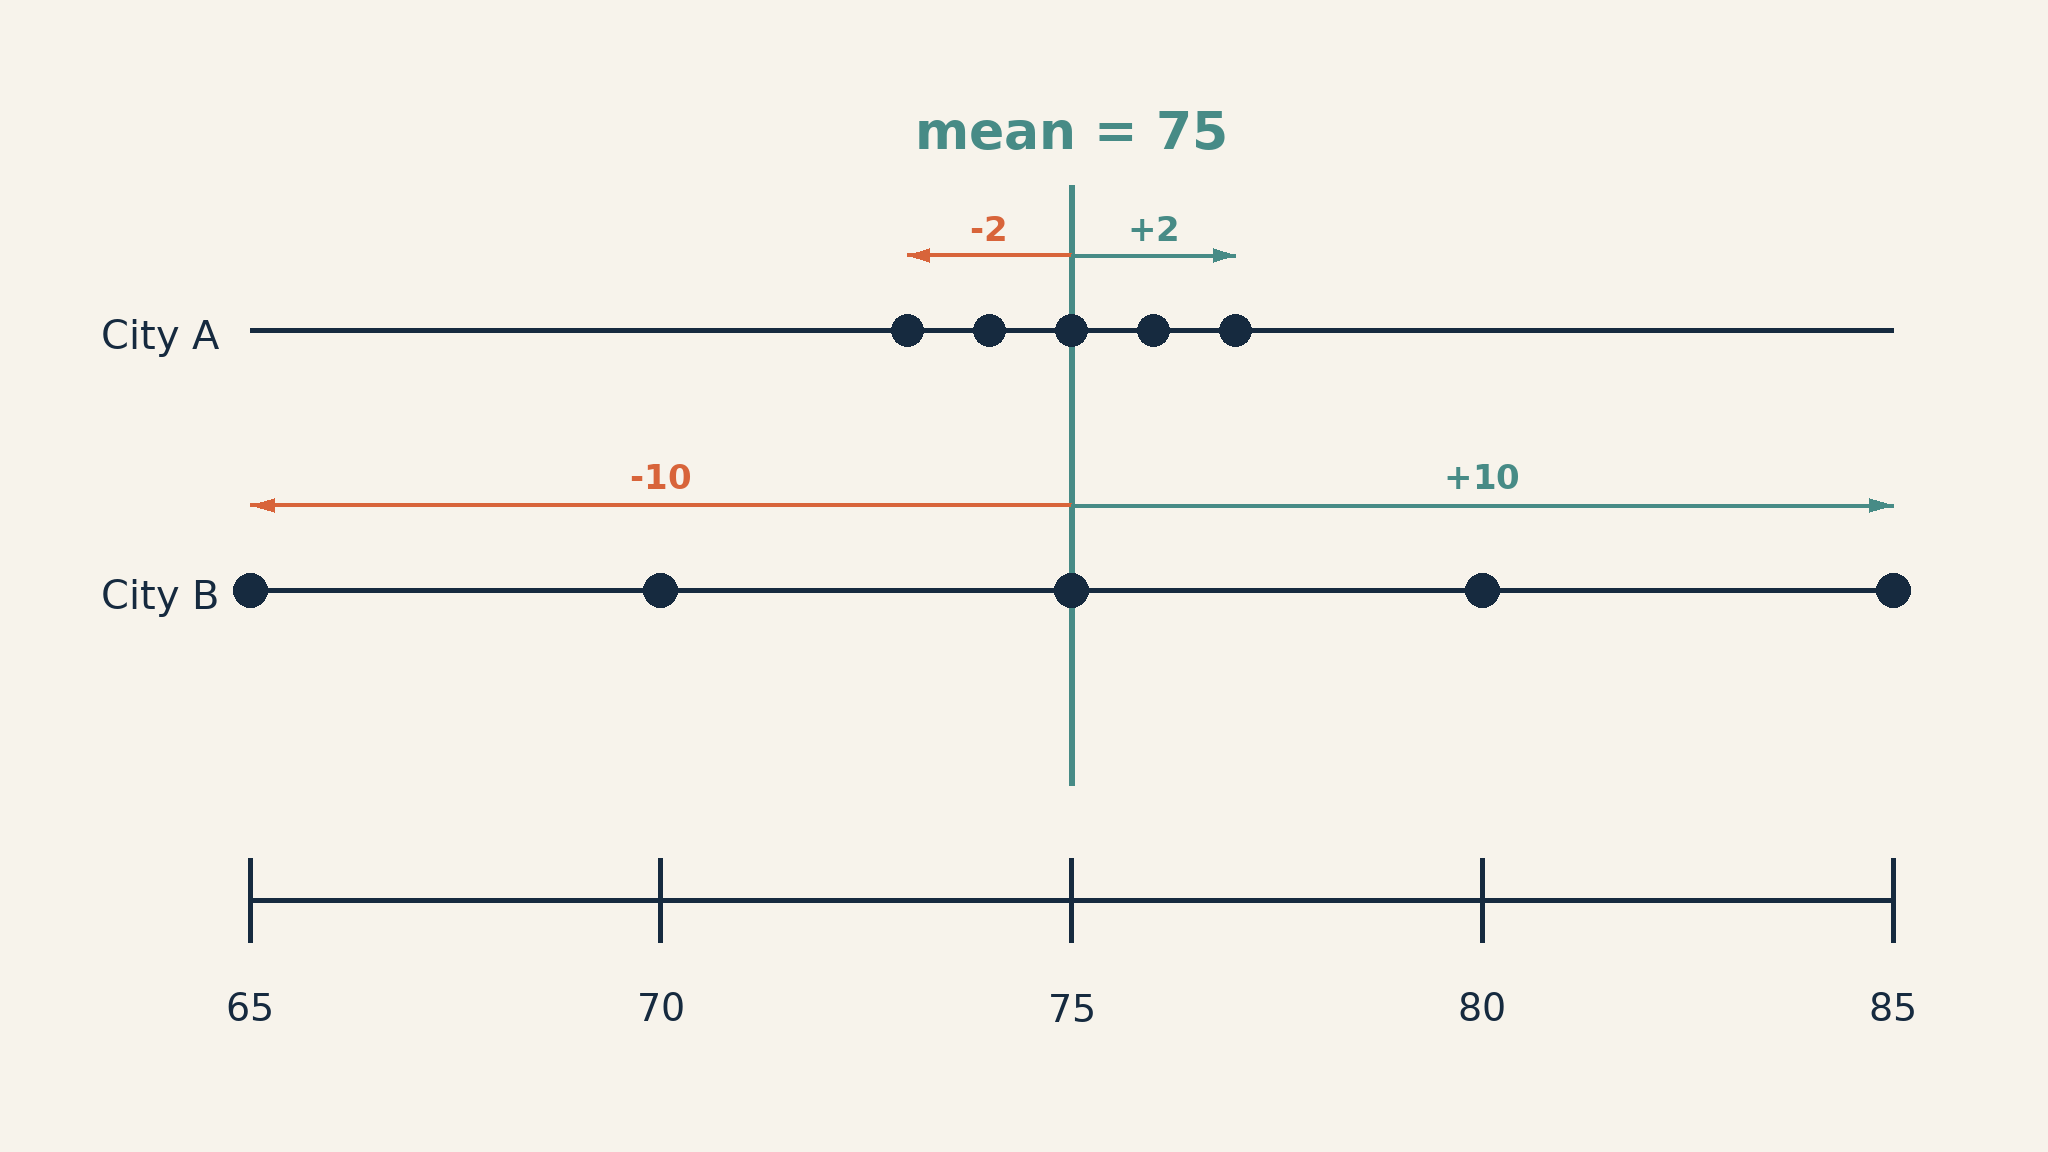
Typical Distance From Mean
Introduction
Welcome back to Understanding Standard Deviation! In our first lesson, we computed signed deviations for every value in a dataset and discovered a curious fact: those deviations always sum to zero. The positive and negative differences cancel perfectly, which means we cannot just add them up to capture overall spread. So how do we turn a whole list of deviations into a single, useful number? That is exactly what this second lesson is about. We will build a clear mental picture of what the standard deviation represents, learn to compare spread visually, and connect the idea to real-world notions of consistency — all before any formula enters the conversation.
What Standard Deviation Represents
Here is the central idea of this lesson: standard deviation tells us roughly how far, on average, data values tend to fall from the mean. Rather than tracking whether each deviation is positive or negative, we focus on the size of those gaps. The standard deviation then rolls all of those distances into one representative number.
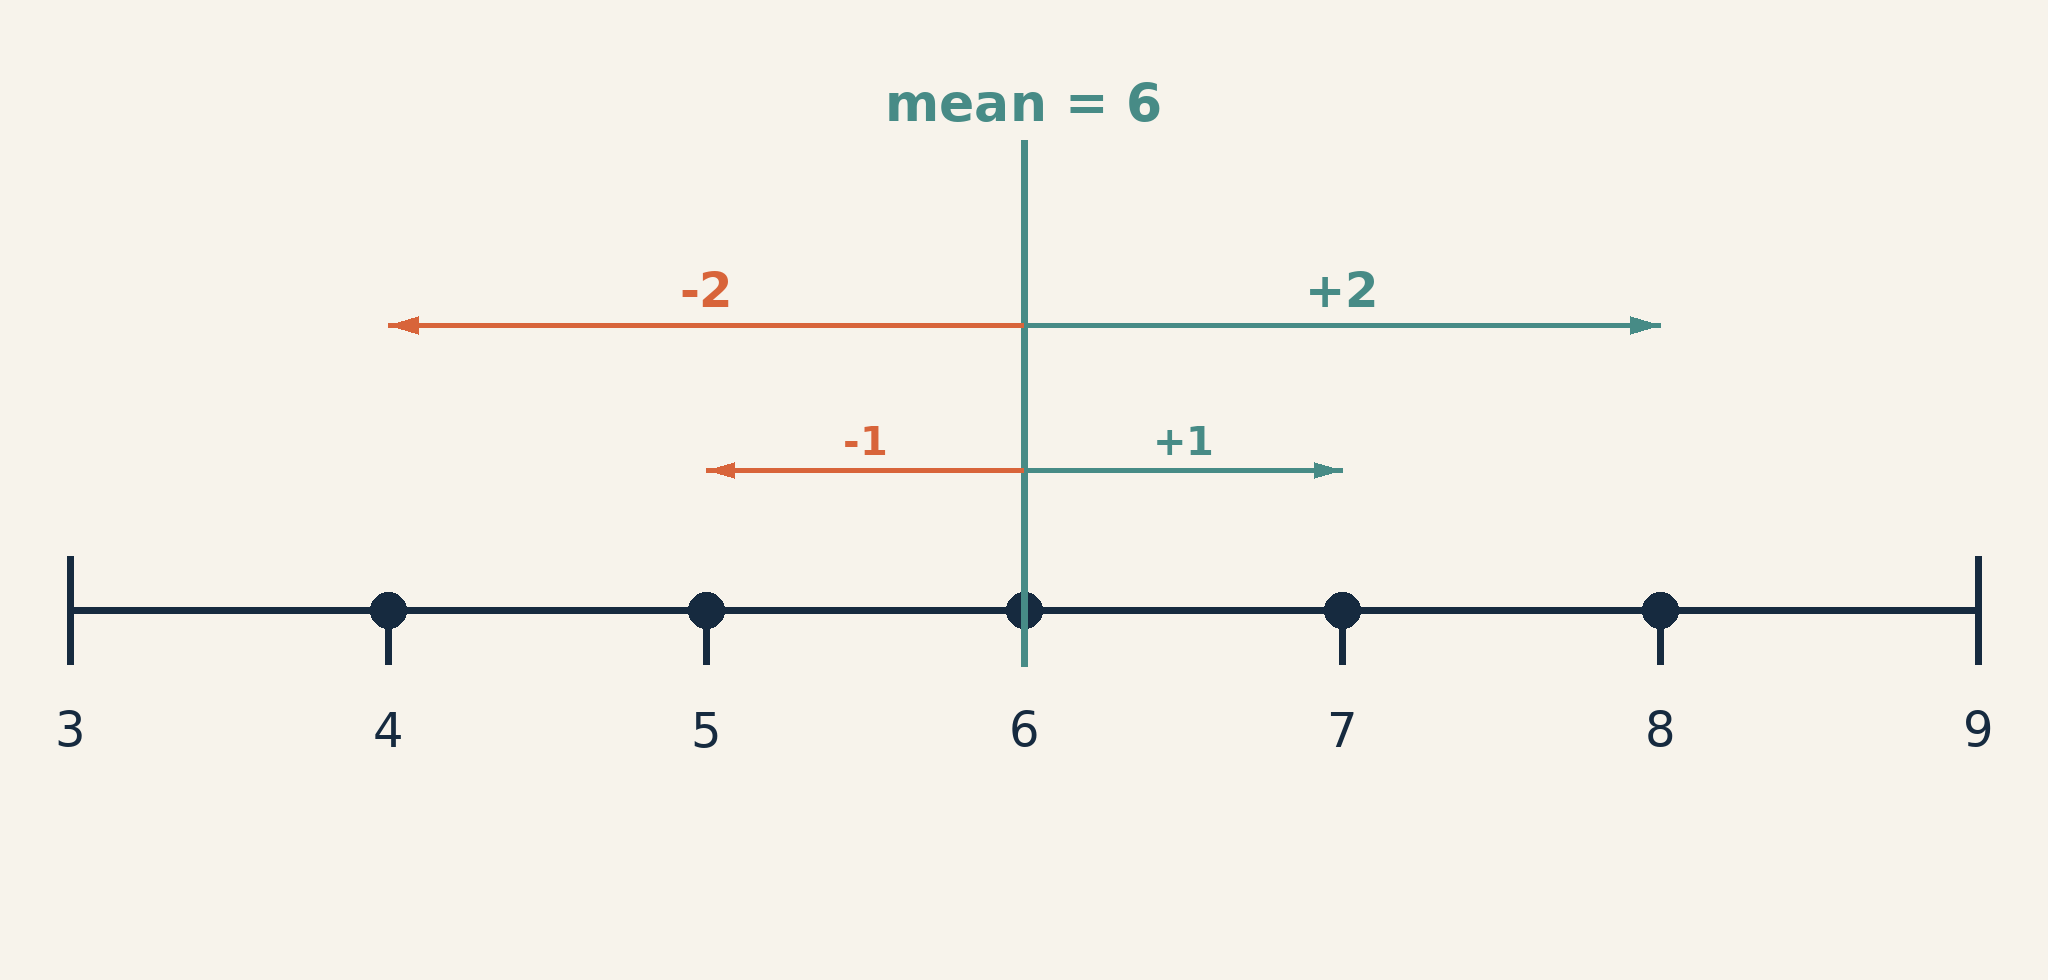
Let's revisit the water-drinking data from our last lesson: 4, 6, 7, 8, 5 glasses, with a mean of . We found the deviations to be . Stripping away the signs gives us pure distances: . Most of those distances are 1 or 2 glasses, so we would expect the standard deviation to land in that neighborhood. The actual standard deviation turns out to be about glasses, fitting our rough estimate nicely.
A quick sketch makes those distances easier to see:
For reference, here is the formula that produces that — the sample standard deviation:
Read from the inside out, it does exactly what we just described by hand: take each deviation , square it to remove the signs, average those squares, and then take a square root to return to the original units (glasses, degrees, points). You do not need to compute with it yet — we will unpack every piece of it, including why the denominator is , in the upcoming lessons. For now, think of standard deviation as answering one simple question: "If I picked a data value at random, how far from the mean would I typically expect it to be?"