Welcome to Understanding Standard Deviation, the fourth course in our learning path! Over the previous courses, you learned how to read distributions, measure center with the mean, median, and mode, and quantify spread using range and IQR. Now we are ready to tackle a more precise and widely used measure of spread: the standard deviation. In this first lesson, we lay the groundwork by introducing deviations from the mean, the small but powerful calculations that everything else in this course is built on.
Throughout this course, all calculations use the population standard deviation, which divides by the total number of values, n. A related formula called the sample standard deviation divides by n−1 and is used when data represent only a subset of a larger group; that version is outside the scope of this course. Let's get started!
Why the Mean Is Only Half the Story
As you may recall from previous courses, the mean tells us where the center of a dataset lies. But two datasets can share the exact same mean and still look very different. Imagine two coffee shops that both average 50 customers per hour. One shop gets between 45 and 55 every hour, while the other swings wildly between 20 and 80. The averages match, yet the day-to-day experience is nothing alike.
To capture that difference, we need to measure how far individual values sit from the mean. That measurement starts with deviations.
What Is a Deviation?
A deviation is the difference between a single data value and the mean of the dataset. If we call a data value x and the mean xˉ, the deviation is:
deviation=x−xˉ
The result carries a sign, and that sign is meaningful:
A positive deviation means the value is above the mean.
A negative deviation means the value is below the mean.
A deviation of zero means the value equals the mean exactly.
Think of each deviation as answering one simple question about a data point: "How far above or below average is this value?"
Computing Deviations Step by Step
Now that we know the formula, let's work through a small example from start to finish. Suppose five friends track how many glasses of water they each drink in a day: 4, 6, 7, 8, 5.
Step 1 — Find the mean.
xˉ=54+6+7+8+5=530=6
Step 2 — Subtract the mean from each value.
Value (x)
Mean (xˉ)
Deviation (x−xˉ)
4
6
4−6=−2
6
6
6−6=0
7
6
7−6=1
8
6
8−6=2
5
6
5−6=−1
Each deviation tells us the direction and distance from the average. The person who drank 4 glasses was 2 below average, while the person who drank 8 glasses was 2 above. Notice that we always compute x−xˉ, not the other way around. The order matters because it preserves the correct sign.
Join the 1M+ learners on CodeSignal
Be a part of our community of 1M+ users who develop and demonstrate their skills on CodeSignal
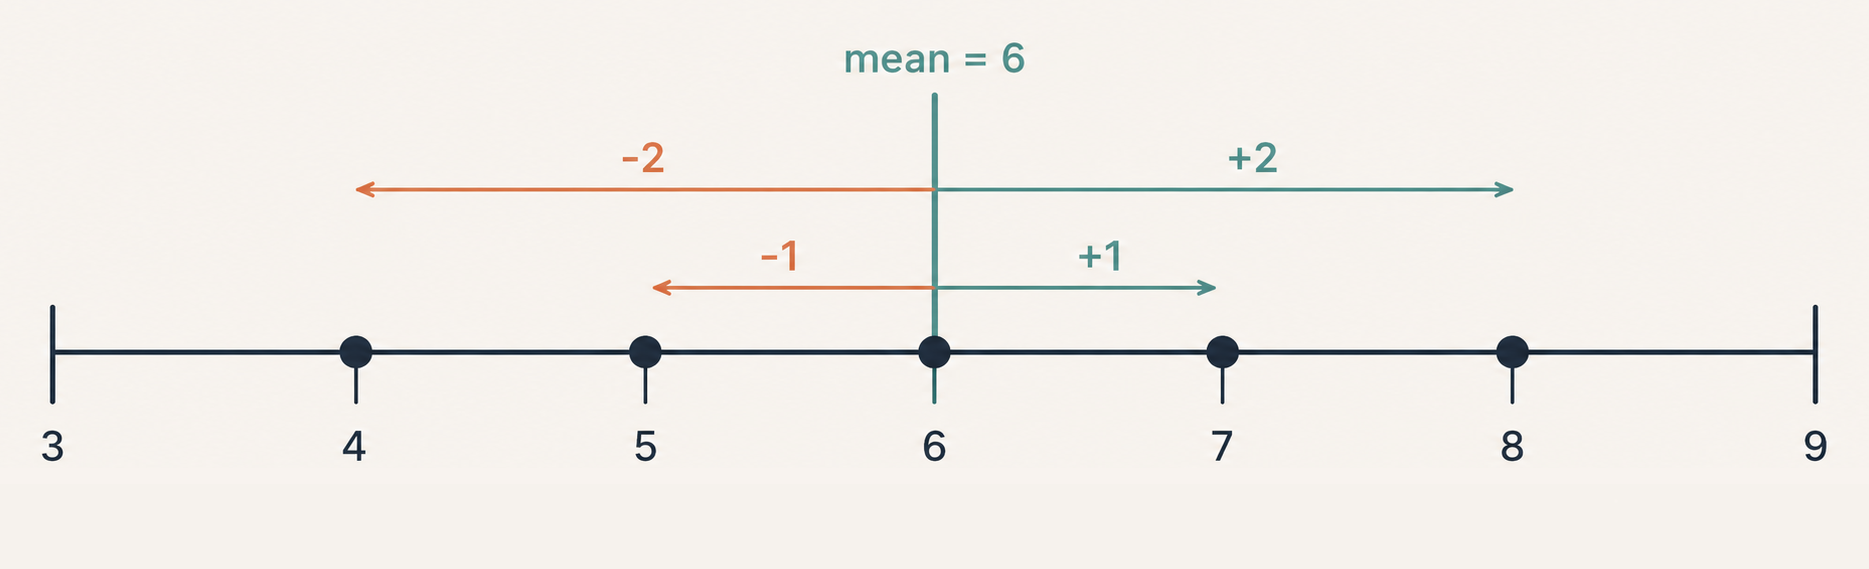
Take another look at the deviations we just computed: −2,0,1,2,−1. Let's add them up:
(−2)+0+1+2+(−1)=0
This is not a coincidence. The sum of all deviations from the mean is always zero (or very close to zero when rounding is involved). This happens because the mean is the balance point of the data: the positive deviations and the negative deviations cancel each other out perfectly.
A quick number-line view of the water example makes this balance easier to see:
This balancing property has an important consequence. It means we cannot simply add up the deviations to get a single measure of overall spread, because that total will always be zero. Later in this course, we will see how squaring the deviations solves this problem. For now, the key takeaway is that deviations carry useful information individually, even though they vanish as a group.
Numbers become truly meaningful when we connect them to real situations. Suppose a small bakery tracks the number of loaves it sells each weekday: 30, 25, 35, 28, 32. The mean is:
xˉ=530+25+35+28+32=5150=30
Now we can interpret each day's deviation in plain language:
Monday:30−30=0 → right at average.
Tuesday:25−30=−5 → five loaves below average.
Wednesday:35−30=5 → five loaves above average.
Thursday:28−30=−2 → two loaves below average.
Friday:32−30=2 → two loaves above average.
With these deviations, the bakery owner can quickly see which days outperformed or underperformed relative to a typical day. A large negative deviation might signal a slow day worth investigating, while a large positive deviation could point to a successful promotion or event. The sign and size of each deviation together paint a clear picture of how each observation relates to the group as a whole.
In this lesson, we defined a deviation as the signed difference x−xˉ between a data value and the mean, computed deviations for small datasets, and discovered that they always sum to zero. These signed deviations are the building blocks of standard deviation and will be central to everything we explore in the rest of this course.
Now it's time to put these ideas into practice with a set of hands-on exercises. You will compute individual deviations, produce full deviation lists, verify the zero-sum property, and interpret what deviations mean in everyday scenarios. Jump in and see how quickly this becomes second nature!