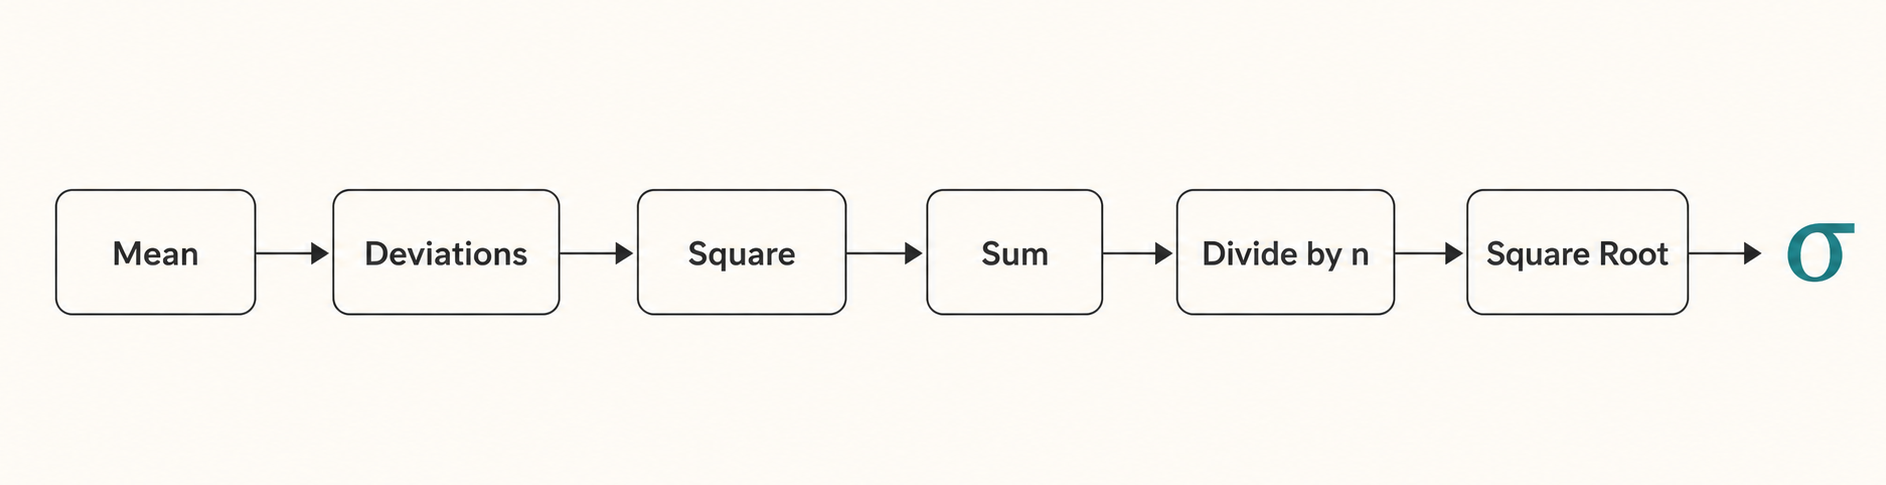
Welcome back to Understanding Standard Deviation! You have reached lesson four of five — the moment where everything comes together. In the previous three lessons, you computed deviations from the mean, developed a conceptual picture of standard deviation as typical distance, and learned why squaring those deviations solves the cancellation problem. Today, we connect all of those pieces into a single, complete calculation that produces the population standard deviation for any small dataset.
From Building Blocks to a Complete Formula
Think of the work so far as gathering ingredients for a recipe. You know how to find the mean, measure each value's distance from it, and square those distances to prevent cancellation. What we have not done yet is combine those ingredients in sequence and finish the dish.
The population standard deviation formula does exactly that. It chains together the building blocks from our previous lessons and adds two final operations — dividing by the number of values and taking a square root — to produce a single number that tells us how spread out the data is. Let us start by looking at the formula, and then we will walk through a full example.
The Population Standard Deviation Formula
The population standard deviation is written as σ (the lowercase Greek letter sigma). Its formula is:
σ=n∑(x−xˉ)2
Each piece maps to a concept we have already explored:
xˉ is the mean of the dataset.
(x−xˉ) is the deviation of each value from the mean (lesson one).
(x−xˉ)2 is the squared deviation (lesson three).
∑(x−xˉ)2 is the sum of squared deviations, all squared deviations added together.
n is the number of values in the dataset.
Dividing by n gives the variance, the average squared deviation.
The square root converts the result back to the original units.
The only truly new operations here are dividing by n and taking the square root. We will see exactly what each one contributes as we work through a full example.
A quick note on terminology: This formula uses n in the denominator and applies when we have data for an entire population. A related formula for samples uses n−1 instead. In this course, we focus exclusively on the population version.
Join the 1M+ learners on CodeSignal
Be a part of our community of 1M+ users who develop and demonstrate their skills on CodeSignal
Walking Through a Full Calculation
How the Steps Fit Together
Conclusion and Next Steps
In this lesson, you assembled the full population standard deviation formula and computed it from start to finish. The key insight is that every step exists for a reason — remove any single one, and the formula either cancels to zero, stays trapped in squared units, or grows unbounded as the dataset gets larger.
Now it is time to put this six-step process into practice! In the upcoming exercises, you will compute population standard deviations for grocery spending, daily step counts, fuel receipts, and commute times. Each dataset gives you a fresh chance to build fluency with the procedure and connect the final number back to what it means in real life.
Suppose we record how many hours of sleep a person gets over five nights: 6, 8, 5, 9, 7. Let us compute the population standard deviation one step at a time.
Step 1 — Find the mean.
xˉ=56+8+5+9+7=535=7
The mean is 7 hours per night. This is the reference point every deviation will be measured from.
Step 2 — Compute each deviation.
Subtract the mean from every data value:
Night
Hours (x)
Deviation (x−xˉ)
1
6
−1
2
8
+1
3
5
−2
4
9
+2
5
7
0
As expected, these deviations sum to zero: (−1)+1+(−2)+2+0=0. That is exactly why we cannot stop here.
Step 3 — Square each deviation.
Night
Deviation
Squared Deviation (x−xˉ)2
1
−1
1
2
+1
1
3
−2
4
4
+2
4
5
0
0
Squaring eliminates the signs and gives extra weight to larger gaps, just as we explored in lesson three.
Step 4 — Sum the squared deviations.
∑(x−xˉ)2=1+1+4+4+0=10
This total captures all of the spread information in a single number.
Step 5 — Divide by n.
There are n=5 values, so we compute:
n∑(x−xˉ)2=510=2
This result, 2, is the variance — the average squared deviation from the mean. On its own, the variance is hard to interpret because its units are squared hours rather than hours. That is why we need one final step.
Step 6 — Take the square root.
σ=2≈1.41
The population standard deviation is approximately 1.41 hours. In plain language, this person's nightly sleep typically differs from the 7-hour average by about 1.41 hours.
Now that you have worked through the entire calculation, let us zoom out and notice a pattern. The six steps naturally fall into three pairs, each pair playing a specific role:
Mean and deviations — The mean establishes the center, and deviations measure how far each value sits from it.
Squaring and square root — Squaring is a temporary detour that stops positive and negative deviations from canceling; the square root at the end reverses it, returning the answer to the original units.
Summing and dividing by n — The sum collects all spread information into one total, and dividing by n turns it into a fair average that does not grow simply because the dataset has more values.
The partnership between squaring and the square root deserves special attention. Without squaring, deviations cancel to zero and we lose all spread information. Without the square root, we would be stuck with "squared hours" — a unit impossible to compare with the original data. These two steps work as a team: one creates the detour, the other brings us back.
That final number, σ≈1.41 hours, is the typical distance from the mean we first described in lesson two. The entire six-step procedure exists to turn raw data into this single, interpretable measure of spread.