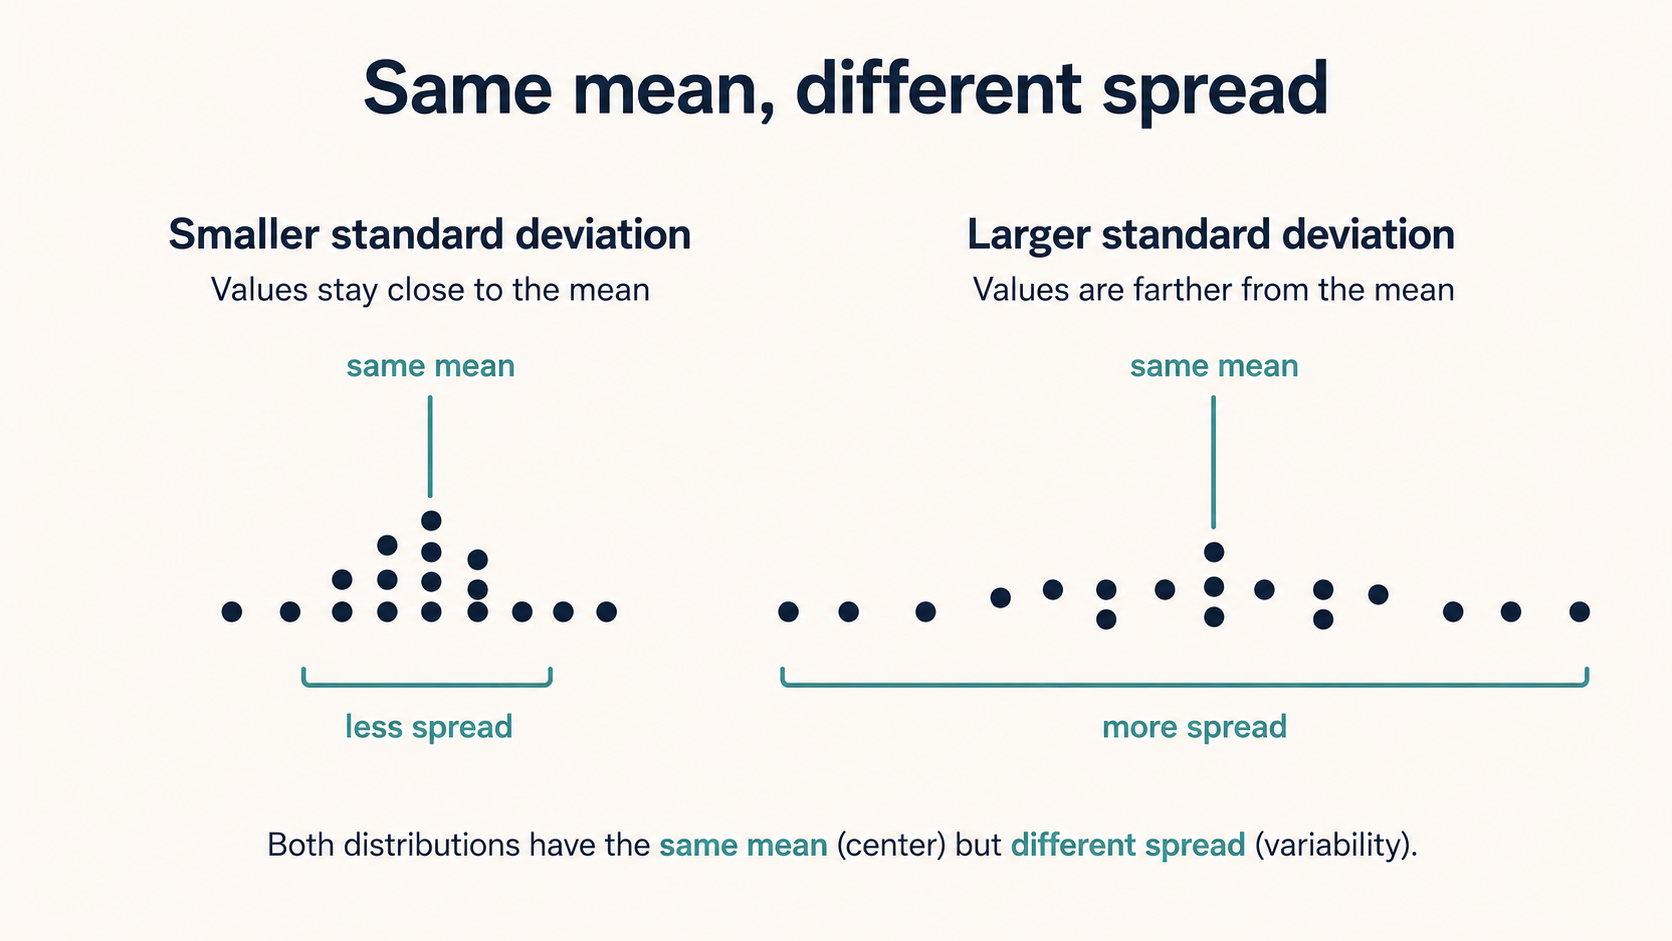
Congratulations — you have made it to the final lesson of Understanding Standard Deviation! Over the course of this unit, you went from computing individual deviations all the way through assembling the full population standard deviation formula. You can now take a raw dataset and produce that single number, σ. But here is a question worth pausing on: once you have that number, what do you actually do with it? This lesson answers that question. We shift our focus from calculating standard deviation to interpreting it — reading the mean and SD as a pair, judging whether the spread is large or small for a given situation, comparing variability across datasets, and communicating findings in plain language that anyone can understand.
From Numbers to Meaning
Knowing how to calculate standard deviation is important, but a number by itself does not help anyone make a decision. Imagine a warehouse manager who learns that the average packing time per order is 12 minutes with a standard deviation of 4 minutes. The math is done, yet the real question remains: What does that actually tell us about day-to-day operations?
The answer lies in interpretation. A standard deviation only becomes useful when we place it next to the mean, consider the units and scale of the data, and explain what the spread implies for real choices. That is the skill we will build in this lesson — turning a pair of numbers into a story that guides decisions.
Reading Mean and SD Together
As you saw in lesson two, the mean tells us where the center of the data sits, and the standard deviation tells us how tightly or loosely values cluster around that center. Neither number is very useful on its own. Together, they paint a much fuller picture.
Consider two pizza delivery services, both operating in the same city:
Mean Delivery Time
SD
Service A
30 min
3 min
Service B
30 min
10 min
Both services share the same average delivery time. But Service A's SD of 3 minutes means most pizzas arrive close to that 30-minute mark. Service B's SD of 10 minutes means a wide swing — some orders arrive in 20 minutes while others might take 40 or longer. The SD is what reveals this difference in reliability.
A helpful way to think about it: the mean sets your expectation, and the SD tells you how much surprise to expect around it. A small SD means few surprises; a large SD means plenty.
Join the 1M+ learners on CodeSignal
Be a part of our community of 1M+ users who develop and demonstrate their skills on CodeSignal
What Counts as "Large" or "Small"?
Comparing Datasets with Standard Deviation
Translating SD into Plain Language
A Quick Interpretation Checklist
Conclusion and Next Steps
In this lesson, you learned to move beyond calculation and into interpretation. The mean and SD together tell a story: where the data centers and how tightly it clusters. By comparing SD values across similar datasets and translating results into everyday language, you can communicate meaningful insights to anyone — regardless of their statistical background. That is the real payoff of everything you have built across all five lessons.
Up next are the practice exercises, where you will compare grocery spending between two households, match delivery services to their likely variability, and write your own jargon-free explanation of a real scenario. This is your chance to show that you can not only compute standard deviation but truly make it speak!
One of the most common questions learners ask is: Is this standard deviation big or small? The honest answer is that it always depends on context. There is no universal cutoff.
A standard deviation of 5 means very different things depending on the variable:
If average exam scores are 80 points and σ=5, scores are tightly grouped. Most students scored between roughly 75 and 85.
If average daily rainfall is 2 mm and σ=5, the spread is enormous relative to the center. Some days see heavy rain while others see none.
The key is to compare the SD to the mean and to the scale of the variable. When the SD is small relative to the mean, the data is consistent. When it is large relative to the mean, the data is highly variable. Always ask yourself: Does this amount of spread matter for the decision at hand?
Standard deviation becomes especially powerful when we compare two or more groups measured in the same units. Let us look at a concrete example.
Two households track their monthly grocery spending over one year:
Mean Spending
SD
Household A
$620
$45
Household B
$590
$140
Household A spends a bit more on average, but its SD of $45 tells us that monthly bills stay fairly close to $620. Household B has a lower mean, yet its SD of $140 signals large swings from month to month — one month might be $450; another might be $730.
If you were helping these households plan a budget, Household A's spending is far more predictable, and that matters for financial planning. Household B would need a larger financial cushion to absorb those swings. Notice that we did not need to see every individual receipt. The mean and SD together gave us enough information to draw a meaningful comparison and a practical conclusion.
In many real-world situations, the person reading your findings is not a statistician. A customer, a manager, or a teammate may not know the term "standard deviation." Your job is to turn the numbers into a clear statement without jargon.
A simple approach works well: state the center, describe the spread as a realistic range, and note that some values fall outside that range. For example, suppose an online retailer reports that its delivery time has a mean of 5 days and a standard deviation of 1.2 days. A good plain-language summary might read:
"Orders typically arrive in about 5 days. Most deliveries land somewhere between roughly 4 and 6 days, though occasionally an order may take a bit longer or show up a bit sooner."
Here is what makes this effective:
It states the center (5 days) without calling it "the mean."
It uses the SD to sketch a realistic range (xˉ−σ≈3.8 to xˉ+σ≈6.2, rounded to 4 to 6 for simplicity).
It acknowledges that some values fall outside that range.
It avoids every technical term — no "standard deviation," "mean," or "sigma."
The interval from xˉ−σ to xˉ+σ is not an exact rule—the actual proportion of values in this range depends on the shape of the distribution—but it offers a rough starting point for sketching a typical range in many everyday contexts. When you write for a non-expert audience, this kind of grounded, concrete language builds trust and understanding far better than raw numbers ever could.
Whenever you are asked to interpret a mean and SD together, run through these five points:
State the center. What is the typical value?
Describe the spread. Use the SD to explain how much values vary around that center.
Sketch a rough range. The interval xˉ±σ can serve as a starting point, though the share of values it captures depends on the distribution's shape.
Compare when possible. If another dataset is available, note which has more or less variability and what that implies for real decisions.
Attach the units. Always include the correct units (minutes, dollars, hours) so the interpretation stays grounded in reality.
This checklist works whether you are writing a formal report or a quick message to a colleague. The goal every time is to make the numbers mean something to the person reading them.