Standardizing Paired Values
Introduction
Welcome back to The Correlation Coefficient! We are now at lesson three of this course. In the first two lessons, we built a solid foundation: we learned how to interpret the value of and how to estimate it visually from scatter plots. Those skills help us describe and judge linear associations, but we have not yet explored how is actually calculated.
That is where this lesson comes in. Before we can compute correlation, we need to put both variables on the same footing through a process called standardizing. By the end of this lesson, we will know how to convert raw values into standardized scores and understand exactly what those scores tell us.
Why We Need a Common Scale
Think about a data set that pairs weekly running mileage (measured in miles) with 5K race time (measured in minutes). Mileage values might range from 10 to 50, while race times might range from 18 to 35. The two variables live on completely different scales with different units.
If we compared these variables using raw values, it would be difficult to judge how a change in miles relates to a change in minutes. Standardizing solves this problem by converting each variable to a common, unitless scale. This normalization allows us to see how each variable varies relative to its own mean and spread, ensuring that the correlation coefficient eventually reflects the underlying relationship rather than the arbitrary units or the magnitude of the raw numbers.
The Standardized Score
A standardized score (often called a z-score) tells us how far a particular value sits from its variable's mean, measured in units of that variable's standard deviation. The formula is straightforward:
Here, is the raw value, is the mean of that variable, and is the standard deviation of that variable. The process has two steps: first, subtract the mean to see how far the value is from center; then, divide by the standard deviation to express that distance in standard deviation units.
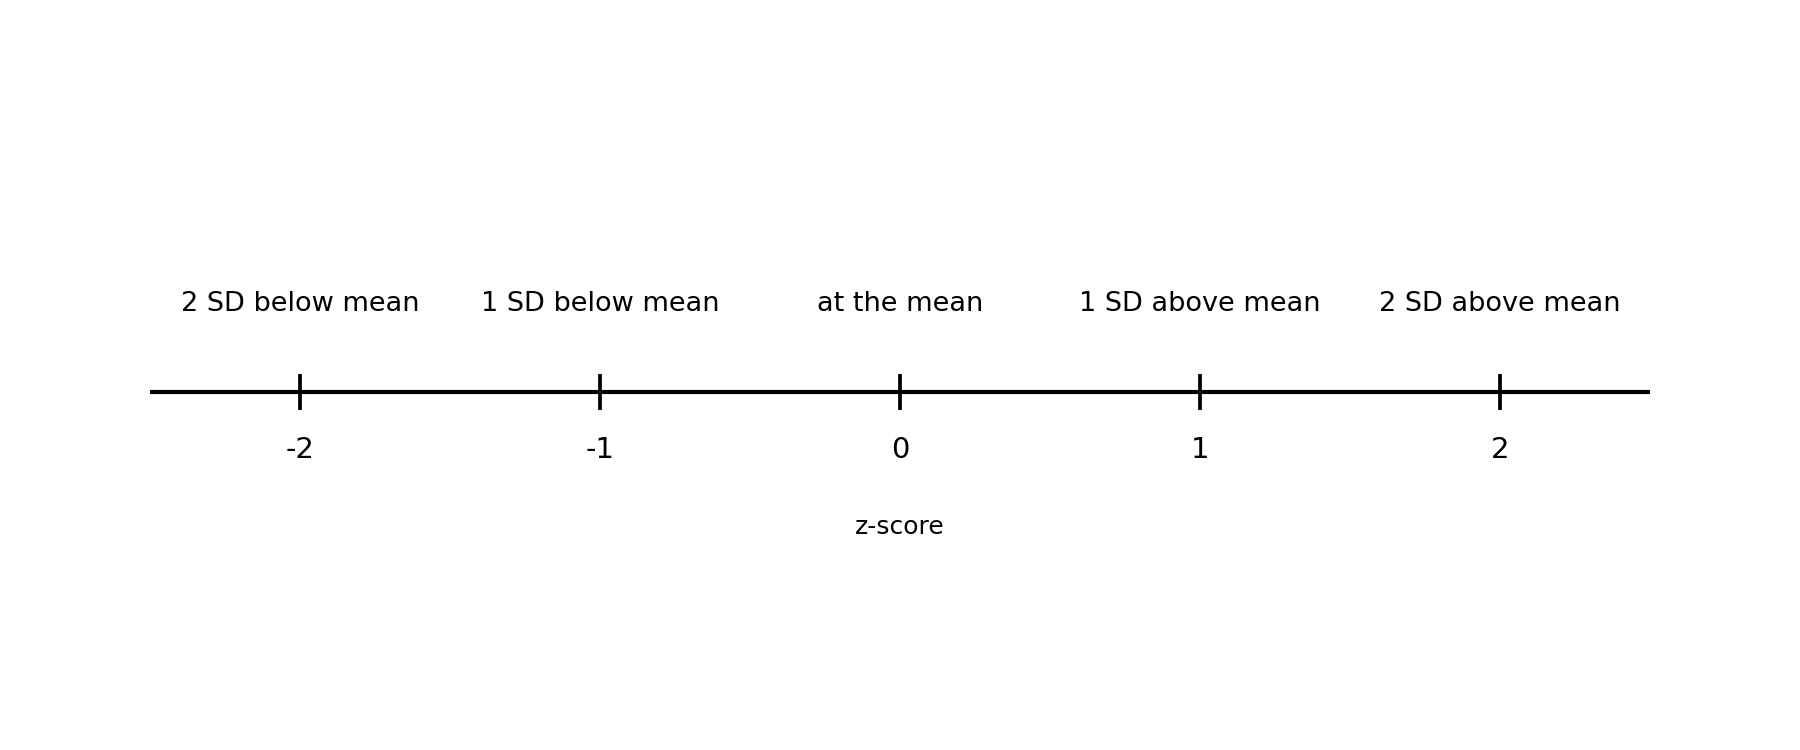
The result is a pure number with no units attached. A standardized score of means the value is exactly one standard deviation above the mean, while means it is two standard deviations below the mean. A score of means the value equals the mean exactly.
A number line can help visualize this interpretation: