Computing Correlation Coefficient
Introduction
Welcome back to The Correlation Coefficient! You are now on lesson four of six. In the first two lessons, we explored what represents and how to estimate it. In the most recent lesson, we learned how to standardize paired values. Now it is time to combine all of those skills and actually compute , step by step.
Why Multiplying Standardized Scores Works
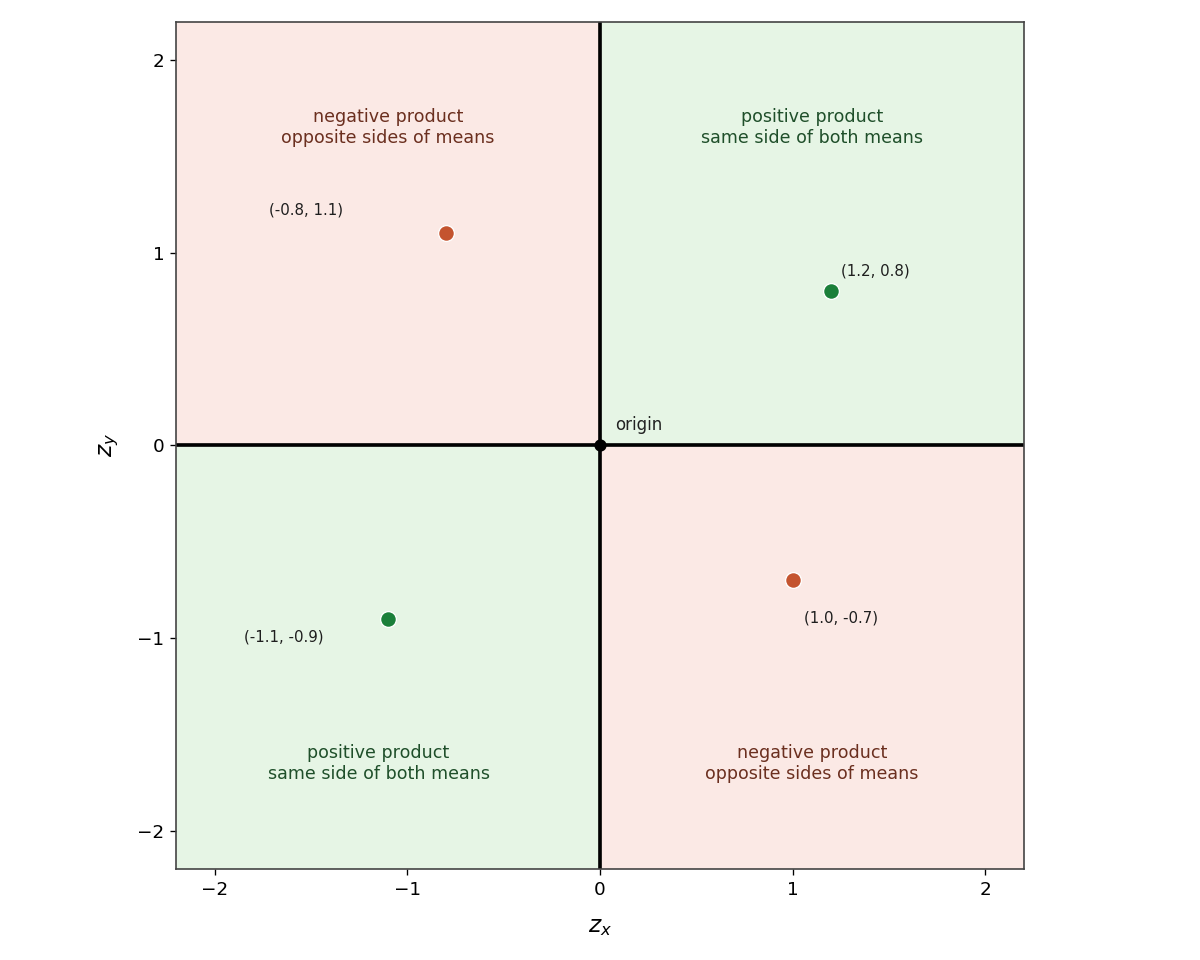
Before we write down the formula, let's take a moment to see why the calculation makes sense. When we multiply the z-scores from a single pair, the sign of the product carries meaning. If both values sit on the same side of their respective means (both above or both below), the product is positive. If they sit on opposite sides, the product is negative.
In a strong positive association, most products will be positive. In a strong negative association, most products will be negative. When there is no clear association, positive and negative products tend to cancel out.
The Formula for r
Given paired observations with standardized scores and , the correlation coefficient is:
The computation follows three clear steps:
- Multiply each pair of standardized scores to get a product.
- Add all the products together.
- Divide the total by , where is the number of pairs.
A Note on the Divisor: You may notice we divide by instead of just . In statistics, the divisor must match the way the data was standardized. Because we use the sample standard deviation () to create our z-scores, we must use to calculate the final average. This ensures remains a valid estimate when working with sample data.
Applying the Formula Step by Step
Suppose four people were surveyed about their weekly exercise hours and self-rated energy level. The data have already been standardized:
| Person | (exercise) | (energy) | |
|---|---|---|---|
| A | |||
| B | |||
| C | |||
| D |
- Multiply: The rightmost column shows the product for each pair.
- Add: .
- Divide: Since there are 4 pairs, we divide by :
