Measuring Data Quality
Measuring Data Quality Across Six Dimensions
In the last unit you parked "data quality" as a single placeholder line on your scorecard, with a promise to sharpen it later. This is later. But here's the problem with that placeholder: "quality" is not one thing. When someone says a dataset is "bad," what are they actually claiming? That it's wrong? Out of date? Missing pieces? Full of duplicates? Those are four different problems with four different fixes, and lumping them under one word is how quality issues stay vague forever.
This unit gives you a sharper vocabulary so you can name exactly what broke, trace it to where it broke, and build a loop that stops it from breaking again.
What Does "Good Data" Actually Mean?
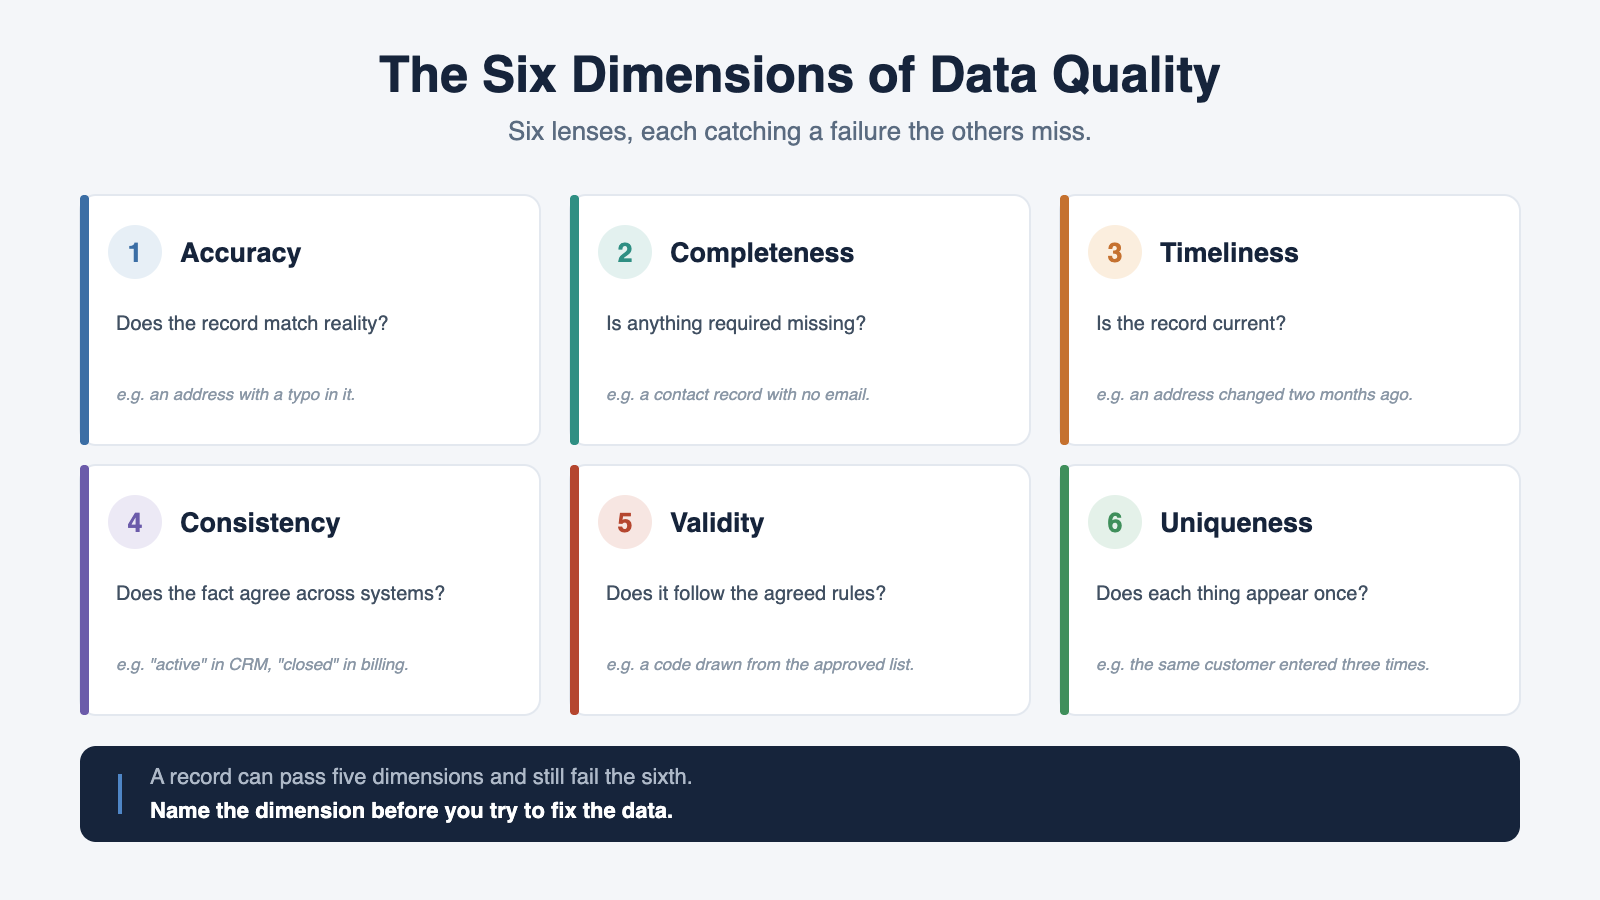
Start by refusing the lazy word. Instead of asking "is this data good?", ask six narrower questions. That's the whole idea behind the Six Dimensions of Data Quality: six separate lenses, each catching a failure the others miss.
The first is accuracy: does the record match reality? A customer address with a typo is complete and properly formatted, but still wrong. The second is completeness: is anything required actually missing, like a contact record with no email in a field that should never be blank? The third is timeliness: is the record current, or does it still show an address the customer changed two months ago?
The fourth is consistency: does the same fact agree across systems? If a customer reads "active" in the CRM but "closed" in billing, neither field is missing or malformed, yet they contradict each other. The fifth is validity: does the value follow the agreed rules and format, such as a country code drawn only from the approved list, or a date that is a real calendar date? And the sixth is uniqueness: does each real-world thing appear exactly once, or has the same customer been entered three times?
Notice how a record can pass five of these and still fail the sixth. A duplicate customer can be perfectly accurate, complete, current, consistent, and valid, and still wreck a count. That's why the dimensions matter: they force you to say which problem you actually have.
When a Number Is Wrong, Where Do You Look?
Here's where most people get it backwards. When a report shows something embarrassing, the instinct is to blame the report. But ask yourself: did the report invent the problem, or just reveal it?
- Chris: The churn report is wrong again. Can we get the reporting team to clean it up?
- Natalie: Before we do, where did those duplicate customers actually come from? The report is only showing us what's already in the system.
- Chris: I suppose whoever entered the orders created new records instead of finding the existing ones.
- Natalie: Right. If we only fix the report, the same duplicates show up again next month. The fix lives where records get created, not where they get counted.
Notice what Natalie did: she separated the symptom (a wrong report) from the root cause (a capture step that lets people create a duplicate instead of matching an existing record). Cleaning the report is treating the bruise while ignoring what keeps hitting it.
So when a quality failure lands on your desk, trace it upstream. Which front-line process produced this? What were people able to do at the moment of entry that they shouldn't have been? Could the system have caught it and didn't? The reporting team is almost never the culprit; they're the messenger. The real story is in how the data got created.
Why the Same Errors Keep Coming Back
If you've ever cleaned up a batch of bad records only to watch the identical mess reappear, you've learned the hard way that one-off cleanup is not a fix. So what closes the gap?
A working feedback loop has five links, and skipping any one of them reopens it. First, someone needs an easy way to submit a flag when they spot a problem; if reporting it is painful, people just live with the error. Second, someone triages the flag to confirm it's real and decide how serious it is. Third, someone fixes it, and not just the single record: they fix the capture step that let it through. Fourth, the resolution gets communicated back to the person who flagged it, so they trust the loop enough to use it again. And fifth, the fix is reinforced, through a tweaked process, a quick reminder, or a check at the point of entry, so the same error stops recurring.
That last link is the one everyone forgets, and it's the only one that actually breaks the cycle. A loop that fixes records but never touches the process that creates them isn't a loop at all; it's a treadmill.
So the takeaway for this unit: "bad data" is a vague complaint until you name the dimension, trace the failure to the front-line step that caused it, and close a loop that reinforces the fix at the source. Up next is a quick pattern-spotting drill where you'll match real failures to the six dimensions, and from there you'll write a root-cause diagnosis and design a feedback loop of your own. As you sort those examples, keep one question in front of you: when something looks wrong in a report, how often are you tempted to fix what you can see instead of what actually caused it?
