Selecting Governance Metrics
Welcome to the Course
Across this path you've defined governance, assigned ownership, classified data, and weighed risk. But here's the uncomfortable question that quietly ends most governance programs: how does anyone actually know it's working? Leadership doesn't fund effort, it funds results, and "we produced a lot of artifacts" is not a result. This course is where you make governance measurable, adoptable, and defensible, so the work you've built survives its first hard look from leadership.
By the end of this course, you'll be able to:
- Distinguish metrics that prove business value from ones that only look busy
- Measure data quality across six dimensions and trace failures to their root cause
- Assess governance maturity using evidence rather than optimism
- Facilitate governance reviews and move resistant colleagues toward shared adoption
- Design and defend a 90-day governance roadmap to leadership
This first unit starts at the foundation: how to tell a meaningful metric from a misleading one, and how to assemble a scorecard a skeptical executive will trust.
Are You Measuring Effort, or Value?
Ask yourself a blunt question about every number you report: does this prove we did something, or that something got better? Those are not the same, and confusing them is how governance ends up "busy but pointless."
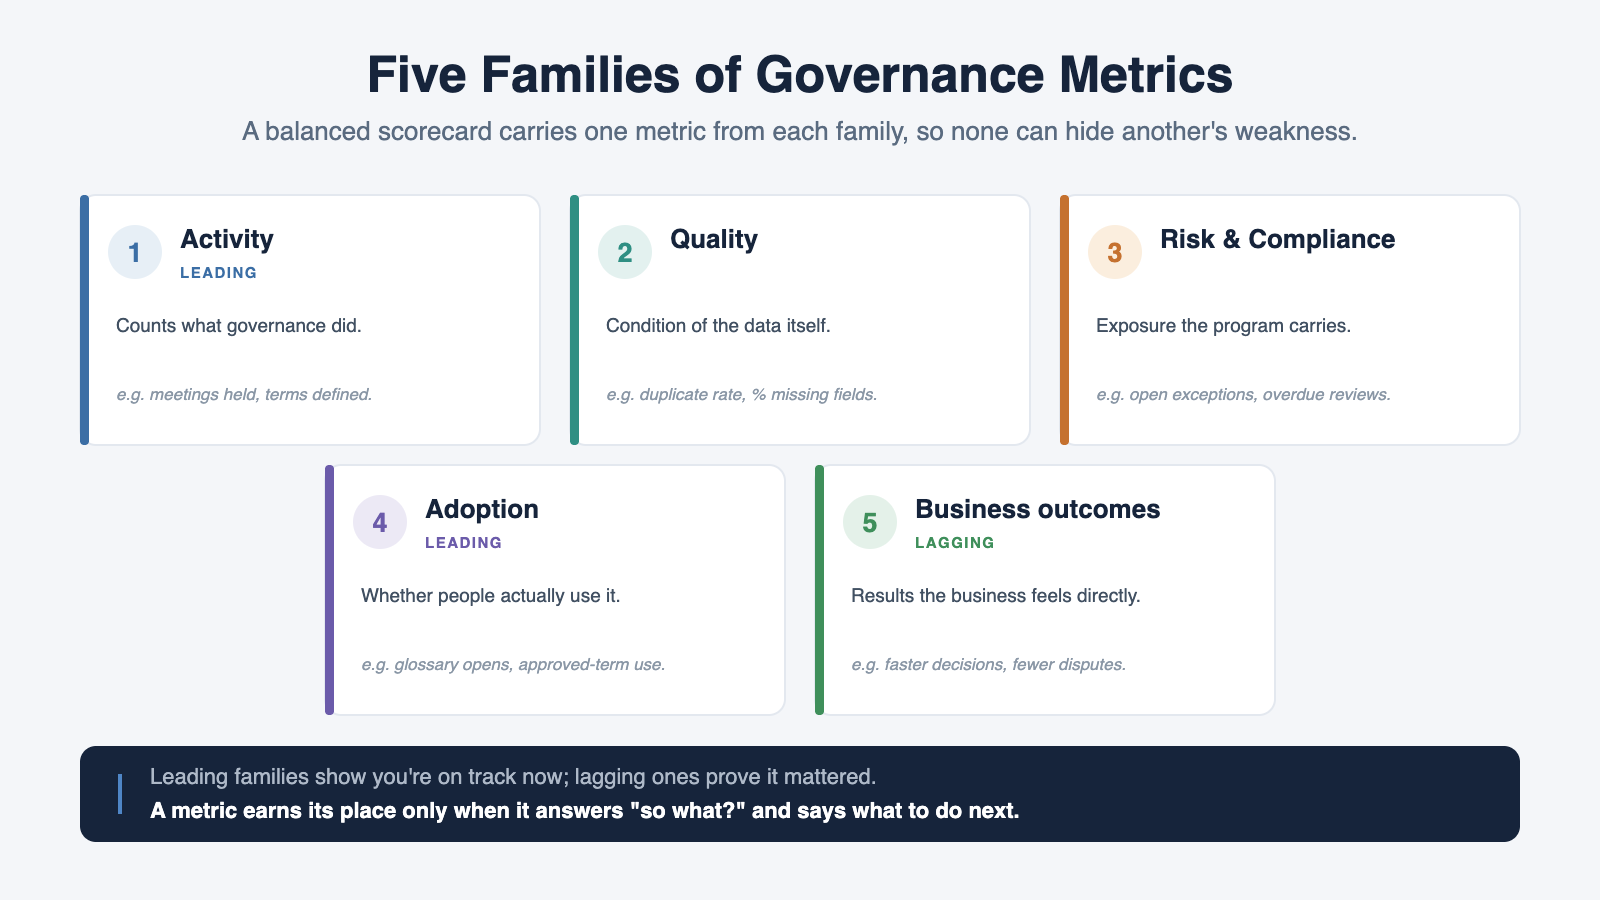
It helps to sort governance metrics into five families. Activity metrics count what you did: meetings held, terms defined, records reviewed. Quality metrics measure the condition of the data itself, like the duplicate rate in a customer list or the share of records missing a required field. Risk or compliance metrics track exposure: open policy exceptions, overdue access reviews, regulated fields without a classification. Adoption metrics show whether people actually use the governance you built: how often the glossary is opened, or what percentage of reports use the approved revenue definition. And business-outcome metrics connect to results the business feels directly: faster decision cycles, fewer reopened number disputes, hours saved each month.
Notice these split into two timing groups. Activity and adoption are leading indicators, early signs that change is taking hold. Business outcomes are lagging indicators, the payoff that shows up later. A credible story needs both: leading indicators tell you you're on track now, lagging ones tell you it mattered. The trap, which we turn to next, is reporting only the easy leading numbers and calling it proof.
The Vanity Metric Trap
Here's the tension at the heart of this unit. The metrics that are easiest to count are usually activity metrics, and activity metrics are exactly the ones that look impressive while saying nothing about value. "We defined 1,200 glossary terms" sounds like momentum. But a sharp executive will ask the only question that matters: "So what? What is different for the business because those terms exist?" If you can't answer, you have a vanity metric: a number that flatters effort but never connects to an outcome anyone cares about.
- Milo: I want to lead our update with "1,200 terms defined." It proves we've been productive.
- Jessica: It does prove effort. But if a leader asks "so what changed?", what's your answer?
- Milo: That... we documented a lot?
- Jessica: Right, and that's where it falls flat. What if we led with "revenue disputes between Sales and Finance dropped from monthly to zero," and kept the term count as supporting proof of how we got there?
- Milo: So the count isn't wrong, it's just not the headline.
That last line is the move. Notice what Jessica did: she didn't throw out the term count, she demoted it. The outcome becomes the headline, and the activity number becomes the evidence underneath it. You rarely delete a vanity metric; you demote it. Replacing a vanity metric isn't about being clever, it's about answering "so what?" before someone else asks it.
Building a Balanced Scorecard
So how do you avoid leaning on any single number? You balance them. A Balanced Governance Scorecard carries one metric from each of the five families, so no category can hide a weakness in another. A pile of activity wins can't disguise the fact that nobody adopts the glossary; a clean adoption number can't paper over a rising risk count.
But a metric on its own is still just a number floating in space. To make each one usable, the scorecard pins down six things: the owner accountable for it, a plain-language definition of what it measures, the source of evidence it comes from, the cadence you review it on, the threshold that separates fine from concerning, and the expected action when that threshold is crossed. Without an expected action, a metric is trivia. With one, it becomes a trigger: "if approved-definition usage drops below 80 percent, the steward investigates why." That is the difference between a dashboard people glance at and one that actually drives behavior.
The single takeaway to carry out of this unit: a metric earns its place only when it answers "so what?" and tells someone what to do next. Everything else is decoration.
Before you build a full scorecard, you'll warm up by sorting individual metrics into the right family, separating the busy-looking numbers from the ones that move a business outcome. As you do, keep the provocateur's question close: of the metrics you report today, how many would survive an executive asking "so what?"
