Measuring the Range
Introduction
You have made it to the fourth of five lessons in Summarizing Sample Data — and with it comes an important shift in perspective. So far, you have learned to summarize a sample with the mean and the median, and you have practiced choosing between them when outliers are present. Those tools answer the question what is a typical value? But knowing the center is only half the story. Starting now, we turn to a second question that is just as important: how spread out are the values? In this lesson, you will learn the quickest way to measure spread — the range.
Why Center Alone Is Not Enough
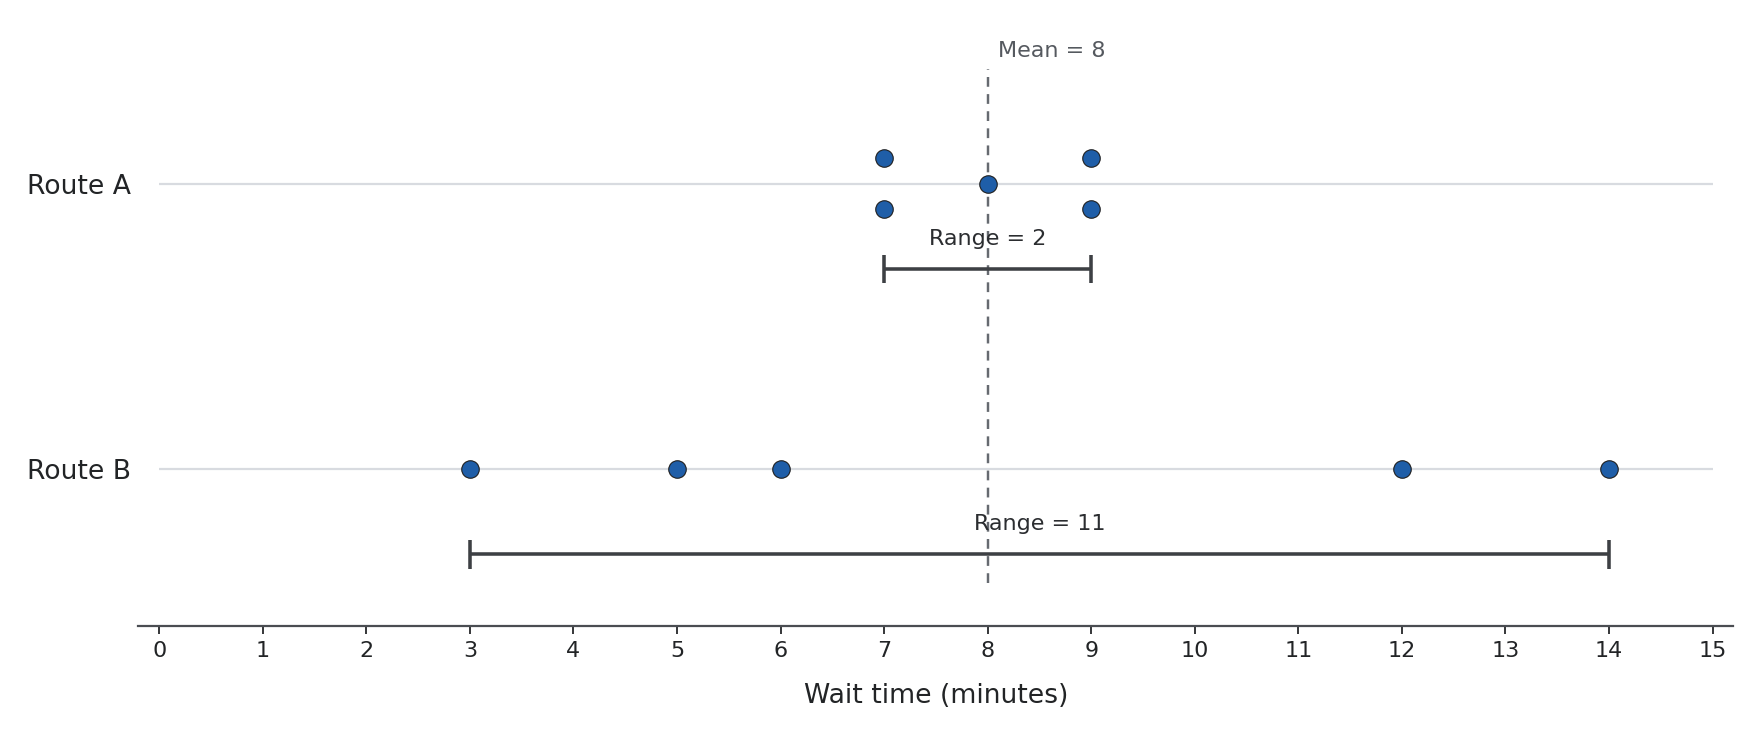
Imagine two coffee shops, each claiming an average wait time of minutes. At the first shop, customers wait between and minutes. At the second, waits bounce anywhere from to minutes. Both shops share the same mean, yet the day-to-day experience feels very different.
The center of a data set tells us where the values cluster, but it says nothing about how tightly they cluster. To capture that tightness — or lack of it — we need a measure of spread. The range is the most straightforward one to start with because it requires just a single subtraction.
What the Range Measures
The range of a sample is the distance between the largest value and the smallest value. It answers one clean question: how wide is the gap from the lowest observation to the highest?
Because it only involves two values and one operation, the range is quick to compute and easy to explain. That simplicity is why it is often the first measure of spread people encounter.
Computing the Range Step by Step
Let's walk through an example. A teacher records quiz scores (out of ) for seven students:
To find the range, follow two simple steps:
- Identify the maximum and minimum. Scanning the list, the highest score is and the lowest is .
- Subtract.
The range of this sample is points. Notice that we did not need to sort the entire list or use every value — just the two extremes.