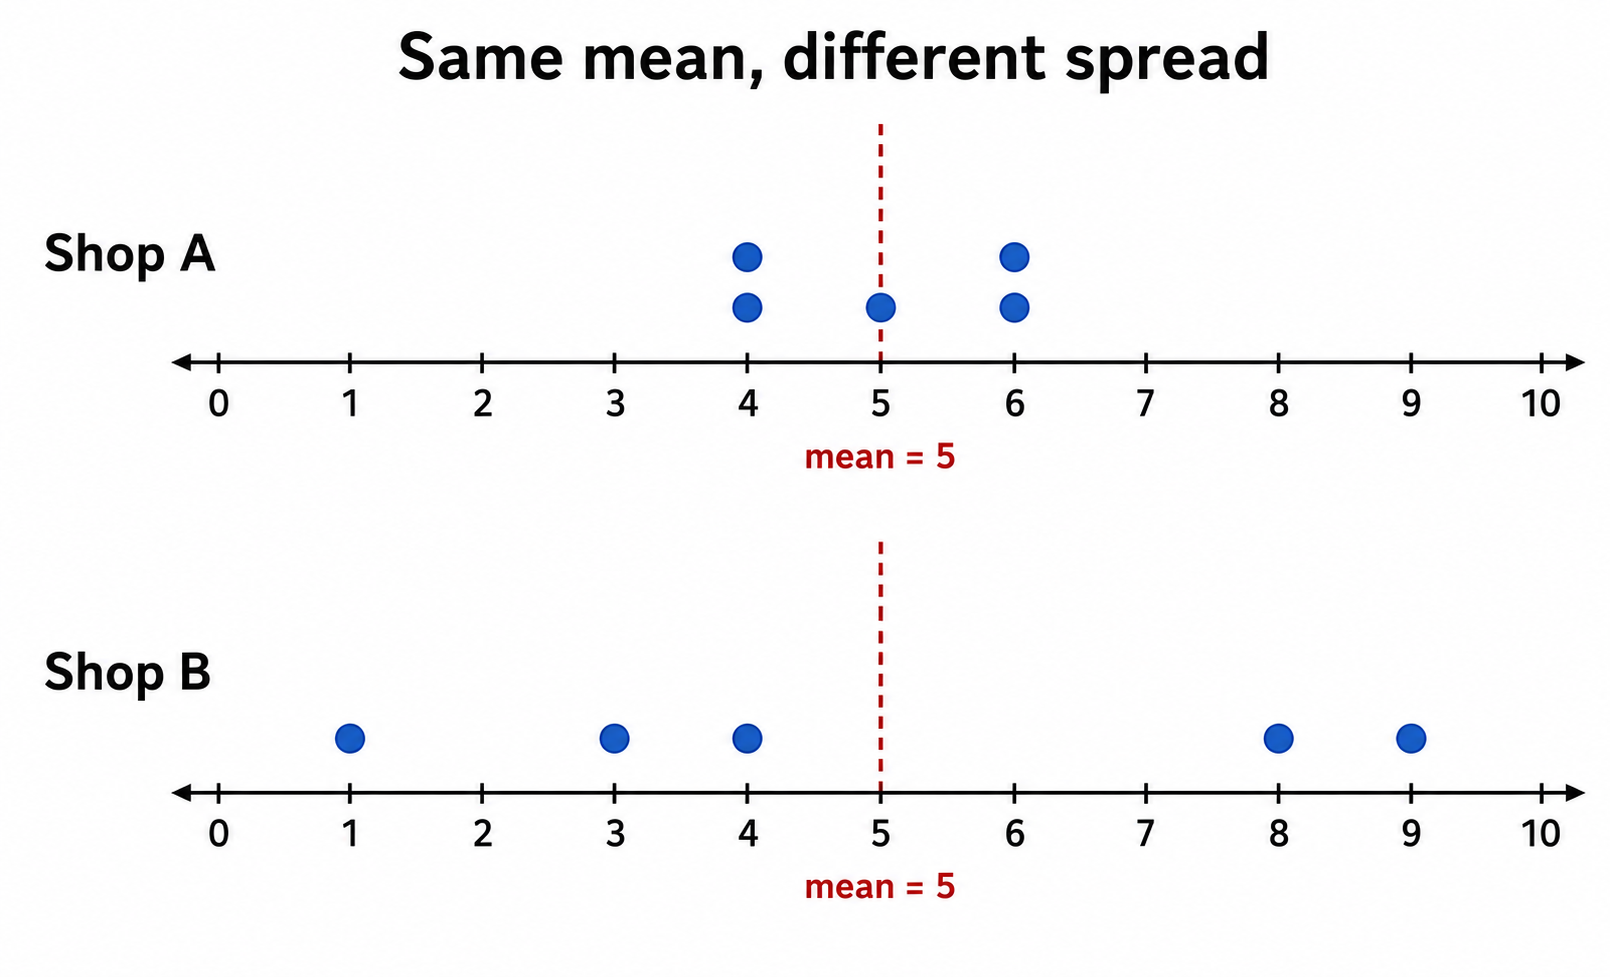
Finding Mean Absolute Deviation
Introduction
Welcome back! You have reached the fifth and final lesson of Summarizing Sample Data, and you should feel proud of how far you have come. You now know how to summarize a sample's center with the mean and the median, and you learned to capture spread with the range. In this lesson, we will add one more tool to your toolkit: Mean Absolute Deviation, often shortened to MAD. It is a more complete way to measure spread, and it will round out everything you have learned in this course.
Why the Range Is Not the Whole Story
As you may recall from the previous lesson, the range uses only two values: the maximum and the minimum. That makes it fast to compute, but it also makes it fragile. A single unusually high or low value can inflate the range and give a misleading picture of how the rest of the data behaves.
Mean Absolute Deviation gives a fuller picture of spread by using every value in the sample. It can still be affected by an outlier, but it does not depend only on the two endpoints. Instead, MAD asks a simple and powerful question: on average, how far do the data values sit from the mean? The answer tells us the typical distance a value lands from the center, giving us a much fuller view of spread.
The Three-Step Procedure
Computing MAD follows three clear stages:
- Find the mean of the sample.
- Measure the absolute distance of each value from that mean.
- Average those distances.
The word absolute is important here. Some values fall below the mean (giving a negative difference) and some fall above it (giving a positive difference). Because we care about how far each value is from the mean, not which direction, we drop any negative signs. In math notation, the absolute value of a number is written , and it simply gives the non-negative version of that number.
A Worked Example
Let's walk through the full procedure. A student tracks how many pages she reads each day for five days:
Step 1 — Find the mean.
Step 2 — Find each absolute distance from the mean.
| Value | Distance from Mean |
|---|---|
On a number line, those distances look like this:
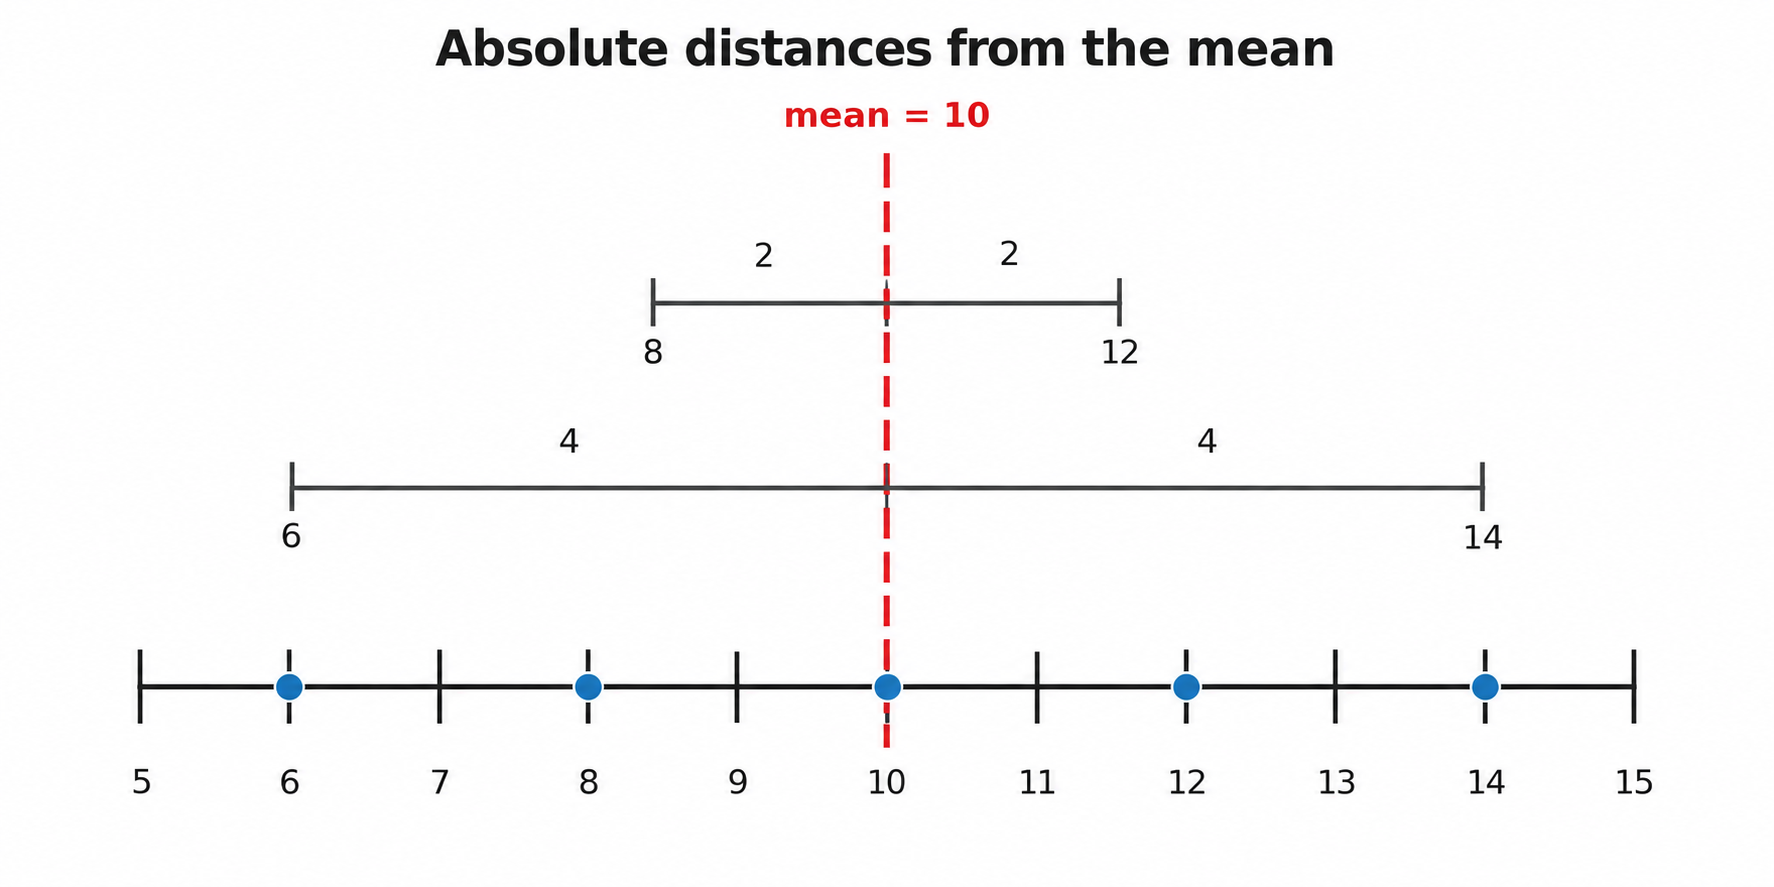
Step 3 — Average those distances.
The MAD is pages. This tells us that, on a typical day, the number of pages she reads falls about pages away from her daily average of .