Comparing Mean and Median
Introduction
Welcome back to Summarizing Sample Data! In this third lesson, you have already learned how to compute the mean and the median of a sample — two different tools that each give you a single number representing what is typical. But what happens when those two numbers point in different directions? In this lesson, we bring both tools together and answer a key question: when the mean and the median disagree, which one should we trust?
Two Measures, One Goal
The mean and the median both aim to capture the center of a data set, but they take very different paths to get there. The mean factors in every single value, while the median relies only on position in a sorted list. Most of the time these two paths lead to roughly the same destination — but when they don't, the gap between them reveals something important about the data. Understanding why they disagree is the key to knowing which one to report.
When the Two Measures Agree
Let's start with a case where the mean and the median tell roughly the same story. Suppose five coworkers report their daily commute times (in minutes):
The mean is:
The sorted list already has sitting in the third position, so the median is also . When the values are spread fairly evenly on both sides, the mean and the median land in nearly the same spot. In a case like this, either measure does a fine job of summarizing the typical commute.
How an Extreme Value Pulls the Mean
Now let's change just one number. Suppose the fifth coworker actually has an unusually long commute of minutes instead of :
The median is still the third value in the sorted list: . But watch what happens to the mean:
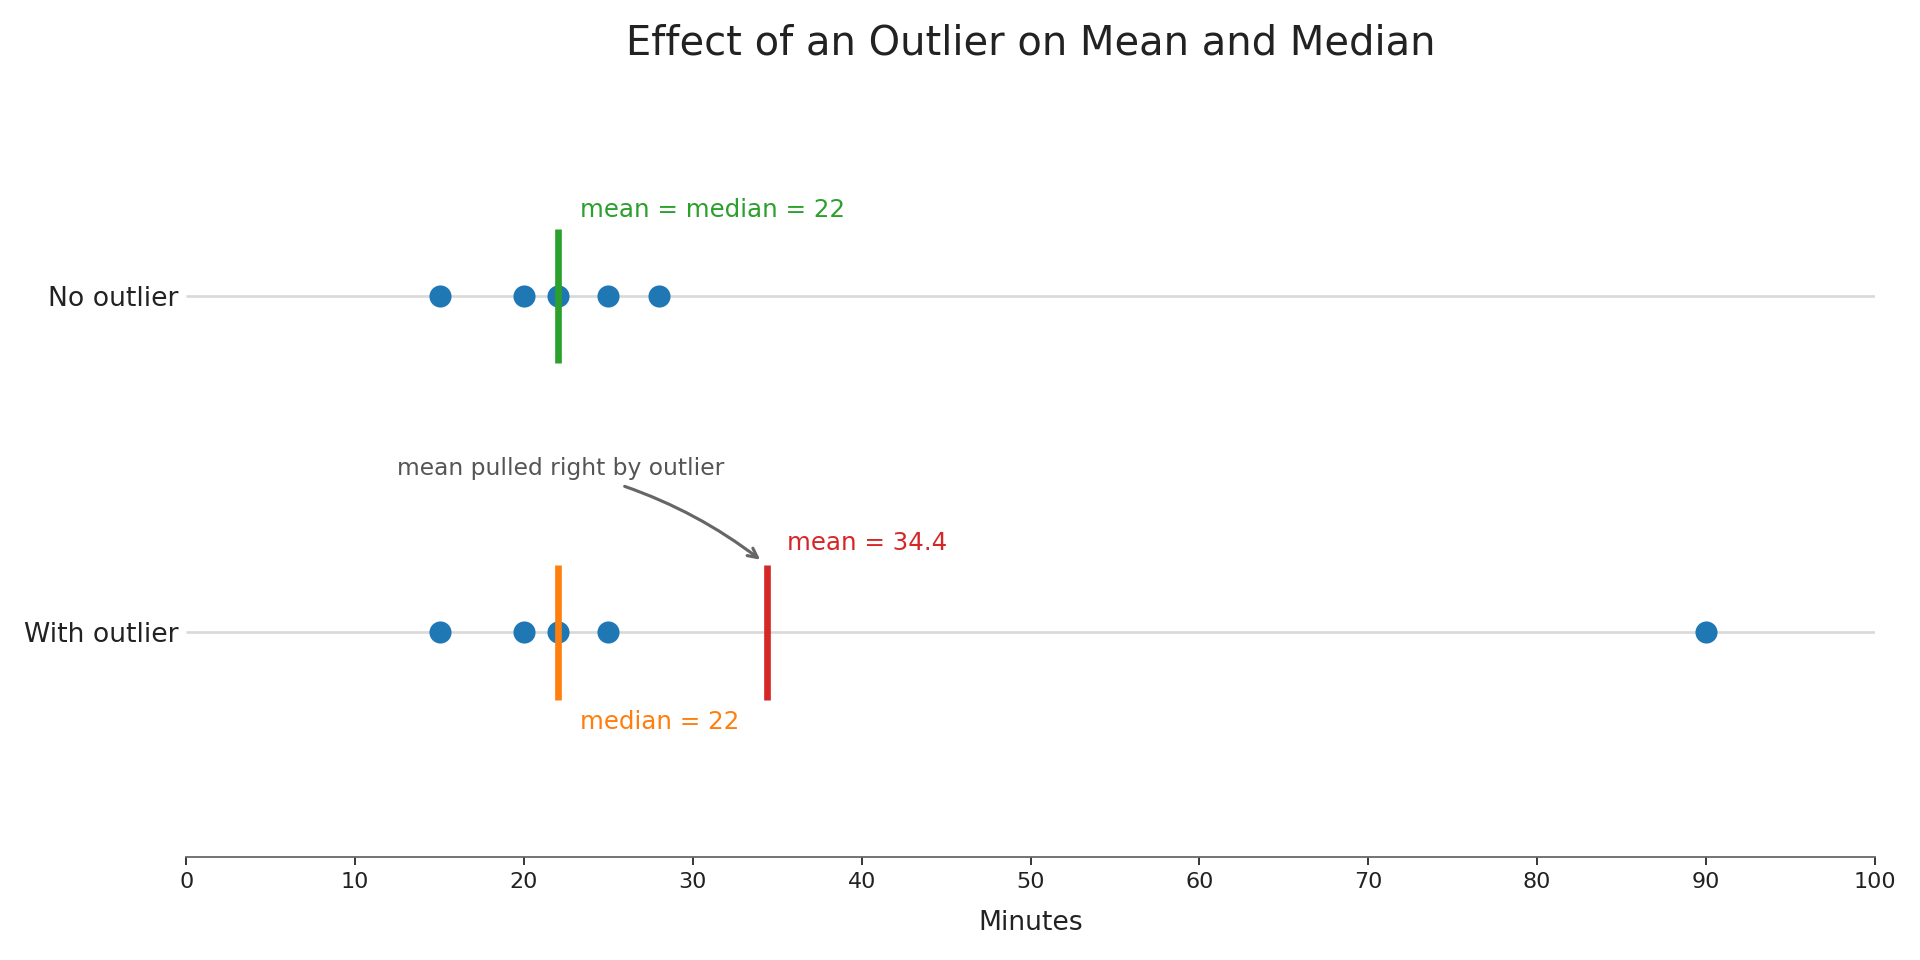
That single large value pushed the mean from all the way up to , yet four of the five coworkers commute minutes or less. The mean of does not feel like a good description of what is typical here. A value like that sits far away from the rest of the data is often called an outlier, and outliers can pull the mean strongly in their direction.
