Finding Extreme Positions
Introduction
Welcome back to Summarizing 2D Arrays Along Axes. We’re now on lesson 3 of 4. In the previous lesson, we found the smallest or largest values in each row or column. But sometimes we need to know where an extreme appears: which row wins, which day has the lowest reading, or which city we should name. We’ll use argmax and argmin to find those positions, then use a parallel array to turn row positions into city names.
From Values to Positions with argmax(axis=0)
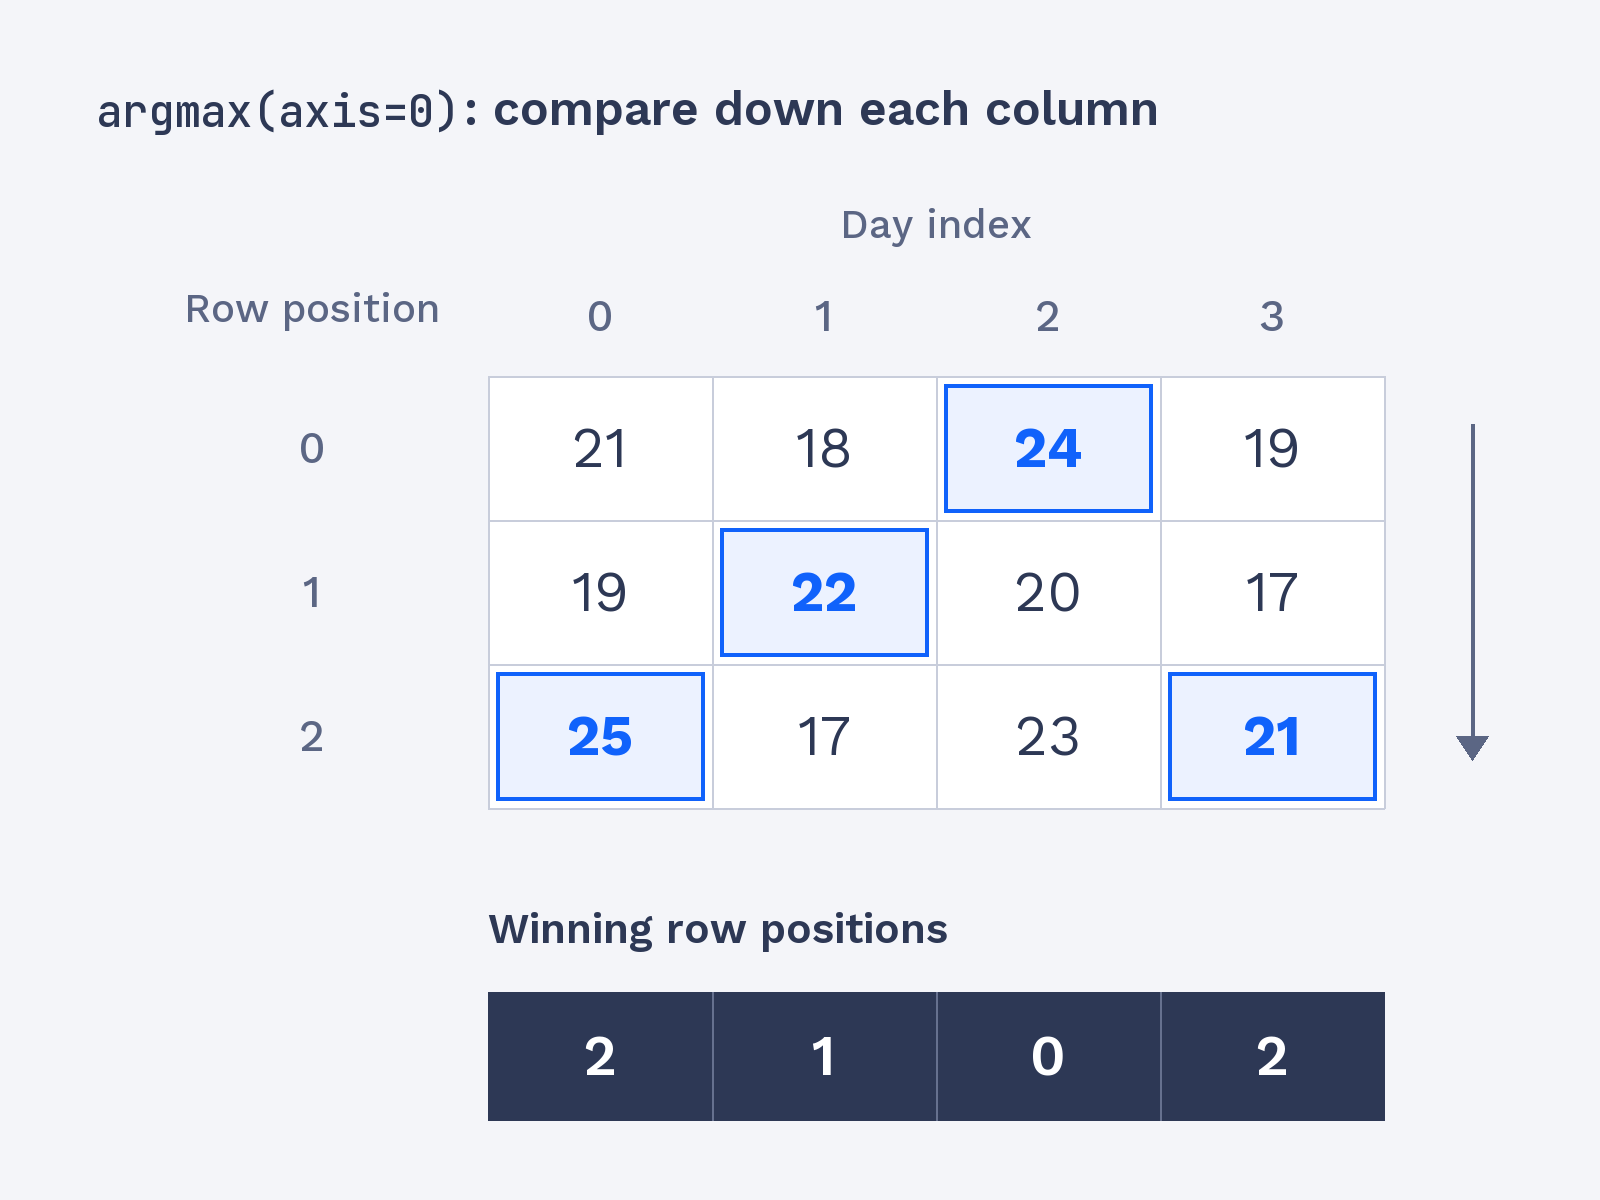
As you may recall from the earlier lessons, axis=0 collapses the rows and leaves one result per column. The max method gives each column’s largest value; argmax gives the row position where that value appears. Our temperature table has three city rows and four day columns, so temps.argmax(axis=0) returns four positions, one for each day.
The first column contains 21, 19, and 25. Its largest value is in row position 2, which is the first result below. Notice that the output contains positions, not temperatures.
The highlighted cells show each column’s largest temperature; the result beneath each column records its row position.
Turning Positions into Names with a Parallel Array
A position becomes more useful when we can connect it to a label. We’ll create a cities array whose order matches the rows of temps: position 0 is Oslo, position 1 is Rome, and position 2 is Lima. As you may recall from earlier work with index lists and parallel arrays, we can use the positions in hottest to gather the matching names.
This prints one city name for each day, in the same order as the four positions. For example, the first position is 2, so the first name is cities[2], or Lima. The result is:
