Aggregating Arrays Along Axes
Introduction
Welcome back to Summarizing 2D Arrays Along Axes. We’ve already used sum to turn a table into whole-table, row, or column totals. In this second lesson, we’ll reuse that axis idea with mean, min, and max. We’ll work through a temperature table, predict how many results each question requires, and then check those predictions against the printed output.
Introducing the Temperature Table and Its Shape
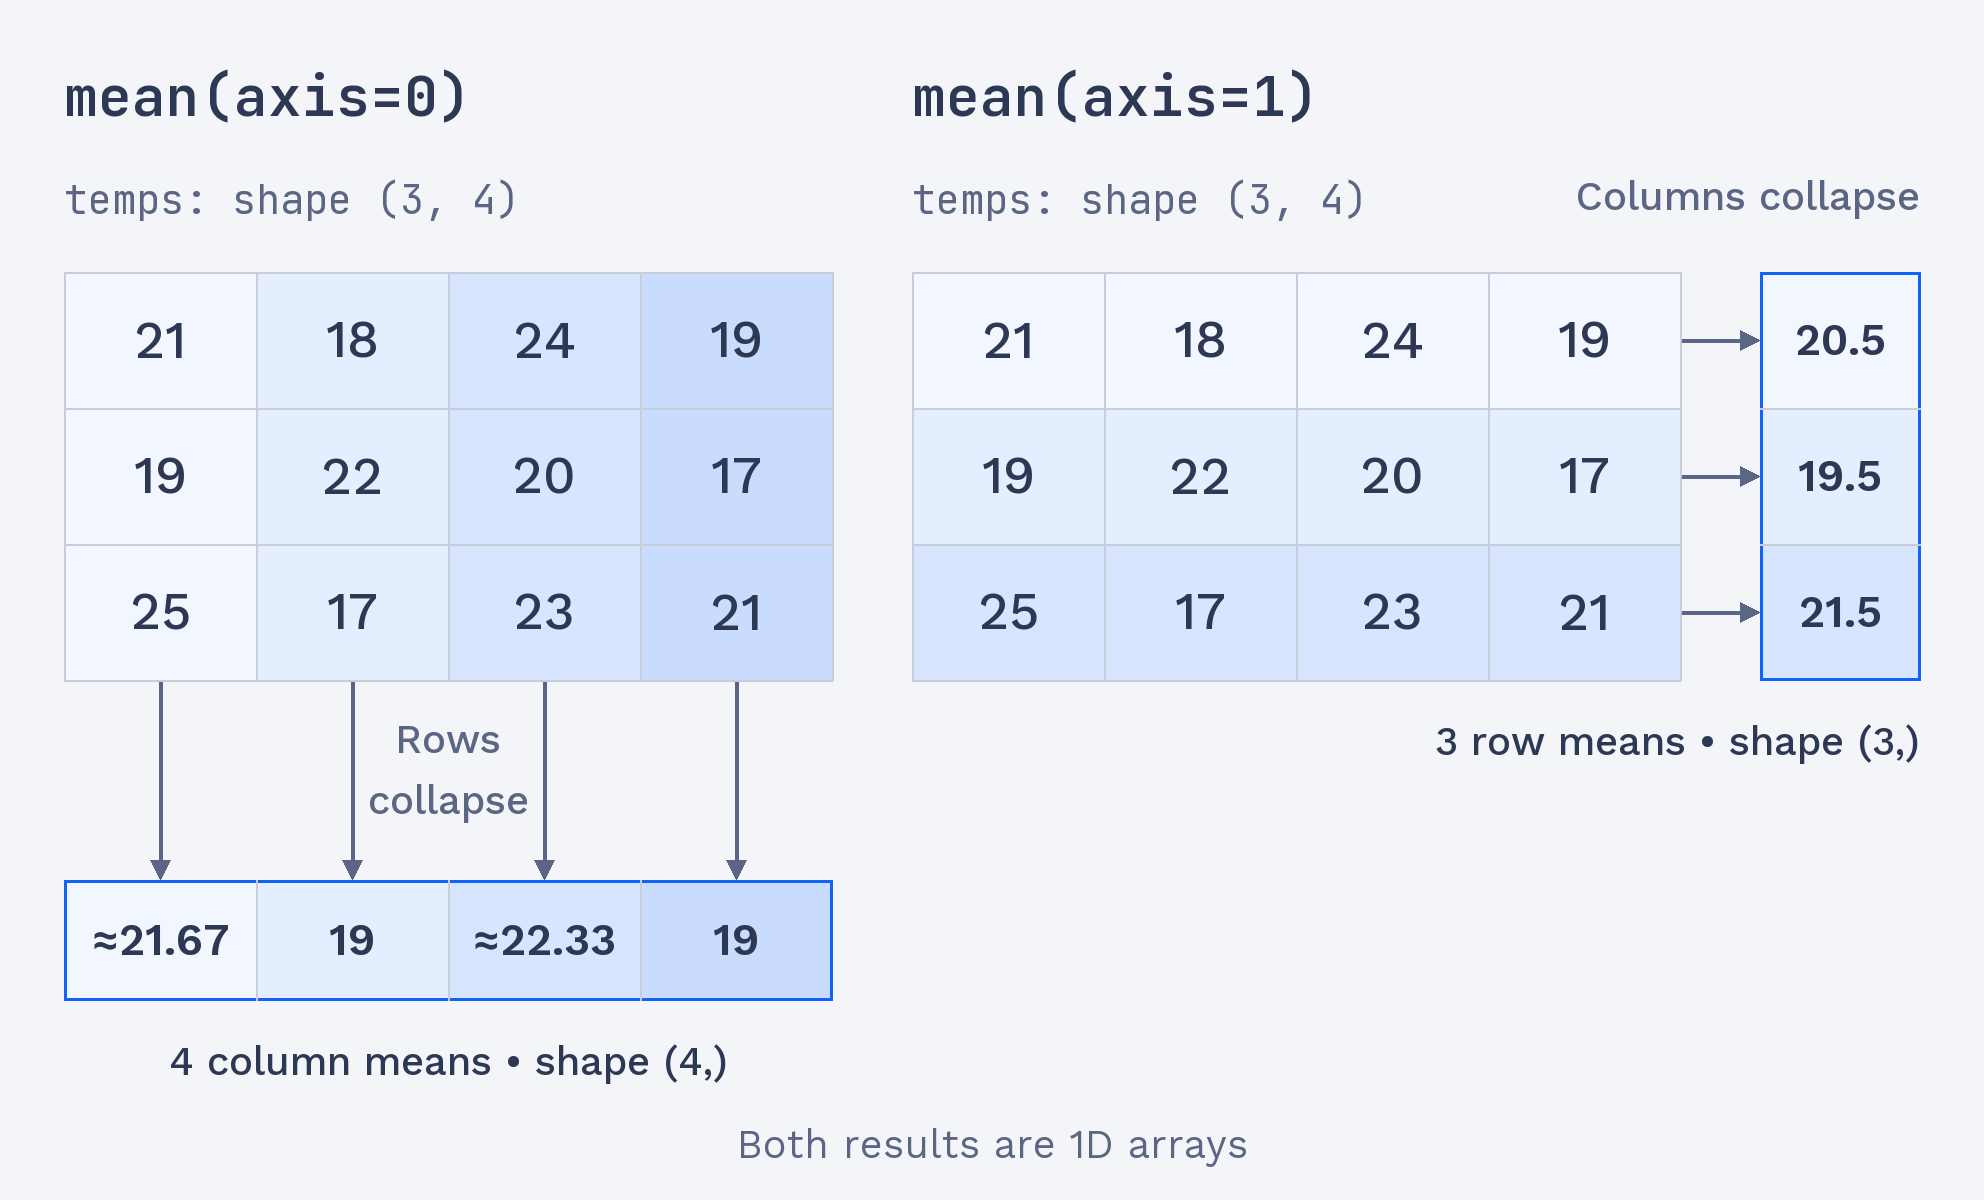
Before choosing an aggregate, let’s look at the data’s shape. This table has three rows and four columns, so temps.shape is (3, 4). As you may recall from the previous lesson, the axis we pass disappears from the result. That rule applies to averages and extremes, too. Before writing any aggregate calls, we can predict that collapsing rows leaves four results, while collapsing columns leaves three.
The array is the same temperature table we’ll use for each question. We’ll keep it unchanged and switch the aggregate or axis as needed. This helps us focus on what each call means.
Column Means with mean(axis=0)
Suppose we want the average in each column. Each result must combine the three values stacked in that column, so the rows collapse. Following the same shape rule as sum, mean(axis=0) leaves the columns and returns four averages. We can predict the result shape, (4,), before running the call.
The first average is calculated from 21, 19, and 25; the remaining averages use the values in their respective columns. The call changes the aggregate from a sum to a mean, but axis=0 still collapses rows.
There are four results because four columns remain. The values are approximately 21.67, 19, 22.33, and 19.
Row Means with mean(axis=1)
Now suppose we want one average for each row. Each result combines the four values across that row, so the columns collapse. We use mean(axis=1), which leaves the three rows and returns a result with shape (3,). The values stay in the same order as the rows in the original table.
The first result averages 21, 18, 24, and 19. The other two results are calculated in the same way for the next rows. We’ve changed the axis from 0 to 1, so the result count changes from four to three.
The output has three values, one for each row. This matches our prediction from the table’s shape.
Side by side, the two mean calls show which dimension disappears.