Welcome back to Slope Changes and Rates of Change. This is the second of three lessons, and it takes the ideas from the first one — steepness from ∣m∣, direction from the sign of m, and a reflection across y=b when m becomes −m — and pushes them much further.
Here is the question that drives this lesson: what happens to the whole graph when we change m to any new value, not just its opposite? Watch a line as its slope changes and it appears to swing like the hand of a clock. We will find the one point that refuses to move, measure exactly how far every other point travels, and distinguish the vertical stretch that pairs points at the same input from a rotation, which generally pairs different points.
The Point That Refuses to Move
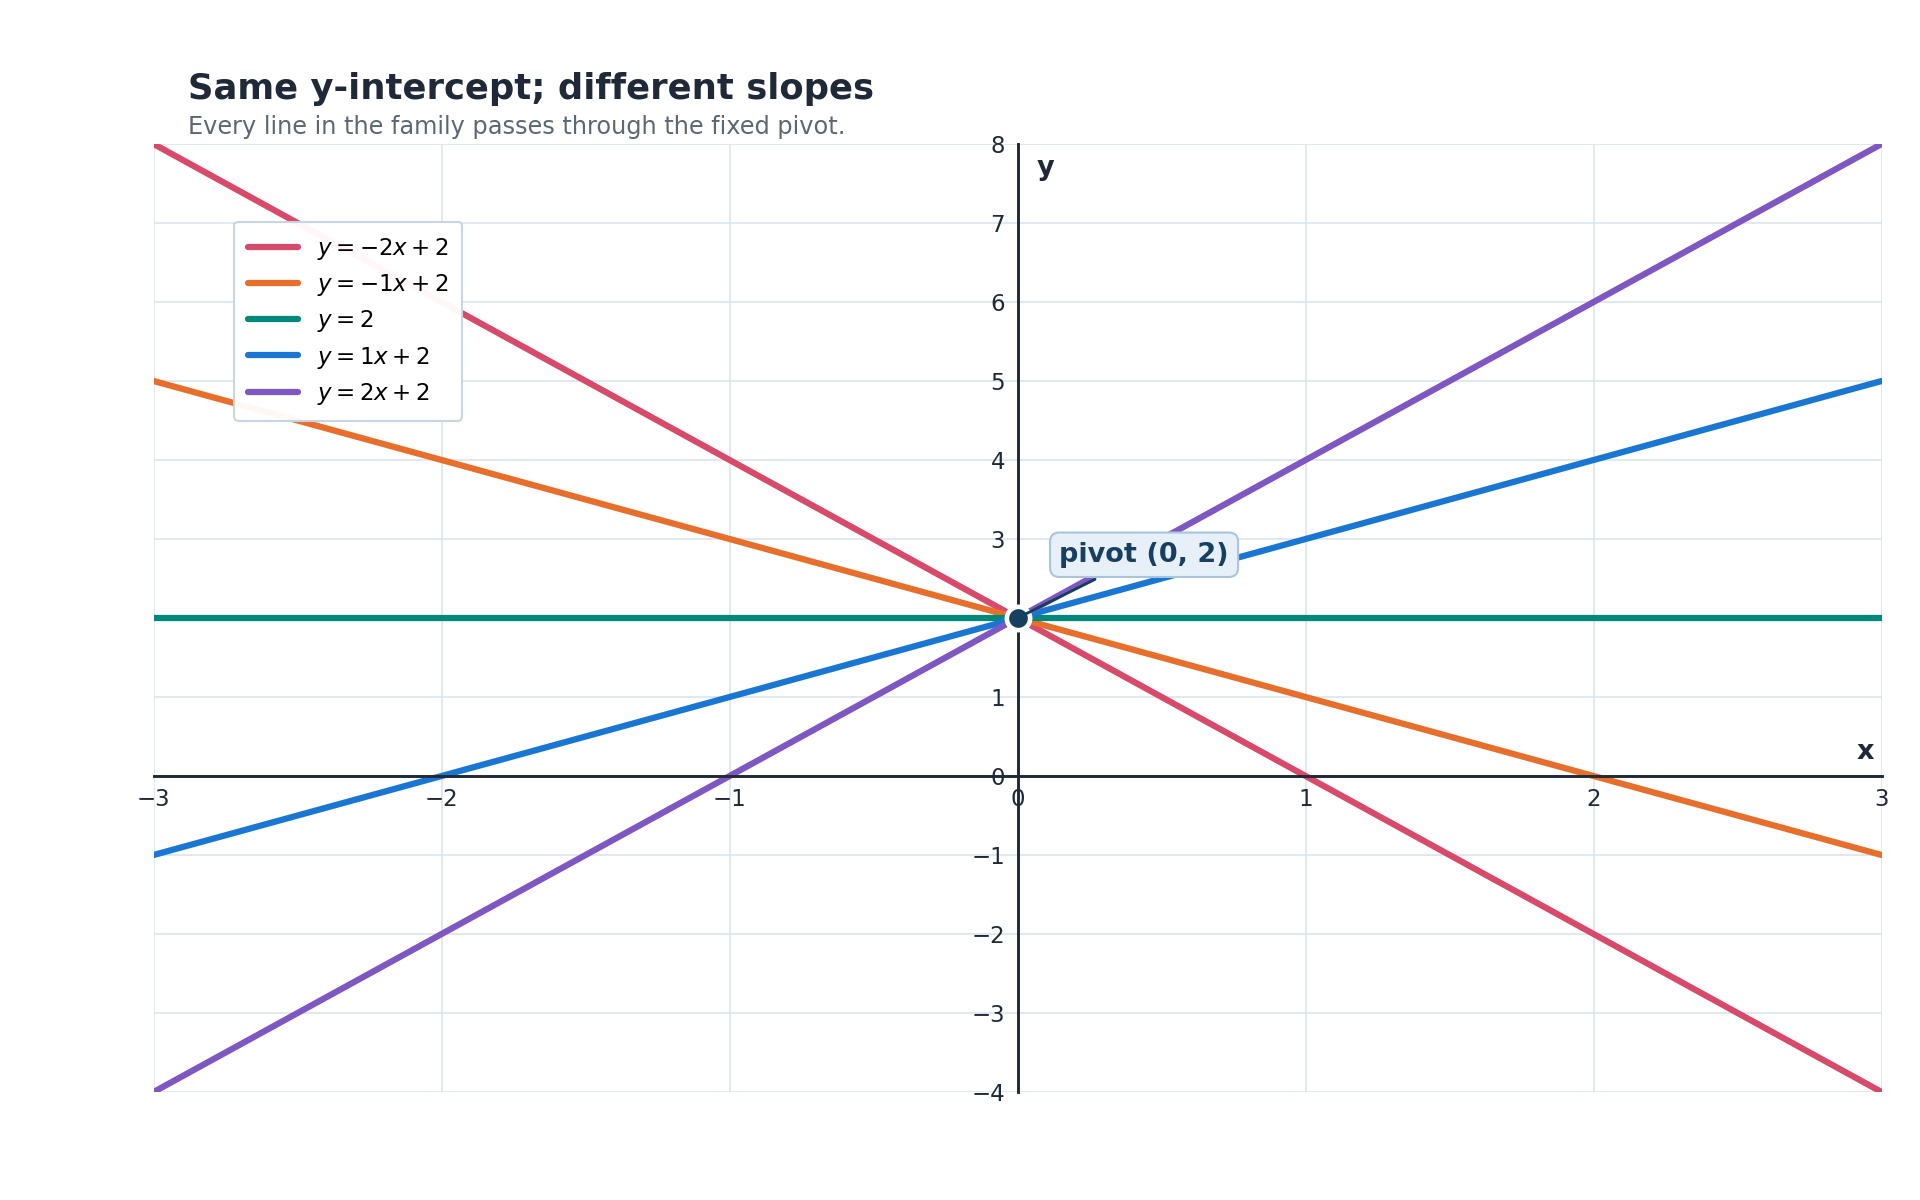
Picture a line on a plot with a slider attached to its slope. As we drag the slider, the line swings: steep, gentle, level, and back again. Almost every point on the graph slides up or down as we drag, but one point stays perfectly still while the rest of the line turns around it.
That still point is called the pivot, and finding it takes a single substitution. Setting x=0 in y=mx+b gives y=m⋅0+b=b, and notice that m disappears from the result entirely. Since the slope cannot influence the output at x=0, the point (0,b) belongs to every line in the family, whichever slope we pick.
Locating the Pivot From a Graph or an Equation
Because the pivot is nothing more than the y-intercept, we can read it two ways, and both are quick:
From an equation in the form y=mx+b: the pivot is (0,b), so y=−4x+7 pivots at (0,7).
From a graph: find where the line crosses the vertical axis; that crossing point is the pivot.
One caution is worth stating. If the equation is not already solved for y, rearrange it first: 2x+y=10 becomes y=−2x+10, so its pivot is (0,10) — not (0,2), and not the point where the line crosses the horizontal axis.
Measuring Everything From the Line y = b
Join the 1M+ learners on CodeSignal
Be a part of our community of 1M+ users who develop and demonstrate their skills on CodeSignal
To describe what happens to all the other points, we need a measuring stick, and the natural choice is the horizontal line y=b running through the pivot. Subtracting b from the output gives the displacement of the line from that height:
d(x)=(mx+b)−b=mx
This one expression tells us two things. The displacement is zero only at x=0, which confirms the pivot, and its size grows steadily as we move away from x=0 in either direction.
In other words, points far from the pivot already sit far above or below the line y=b — and those are exactly the points with the most room to move when the slope changes.
Now compare two lines with the same intercept but different slopes, y=m1x+b and y=m2x+b. Their displacements from y=b are m1x and m2x, and comparing them reveals a single constant factor that does not depend on x:
k=m1m2⟹m2x=k⋅(m1x)
At every input, the new height above (or below) y=b is exactly k times the old height. Changing the slope from m1 to m2 is a vertical stretch by the factor k=m2/m1, applied to the displacement from y=b. This is the same output scaling from the earlier course on stretching graphs, with one difference: the line that stays fixed is y=b instead of the x-axis.
Factor k=m2/m1
What happens to the graph
k>1
displacements grow; the line steepens
k=1
nothing changes; same line
0<k<1
displacements shrink; the line flattens
k=0
all displacements become 0; the line becomes y=b
−1<k<0
reflection across y=b plus compression; the line flattens
k=−1
reflection across y=b
k<−1
reflection across y=b plus stretch; the line steepens
The factor is undefined when m1=0, and that makes sense: a horizontal line has zero displacement everywhere, and multiplying zero by any number still gives zero, so no stretch can tilt a flat line.
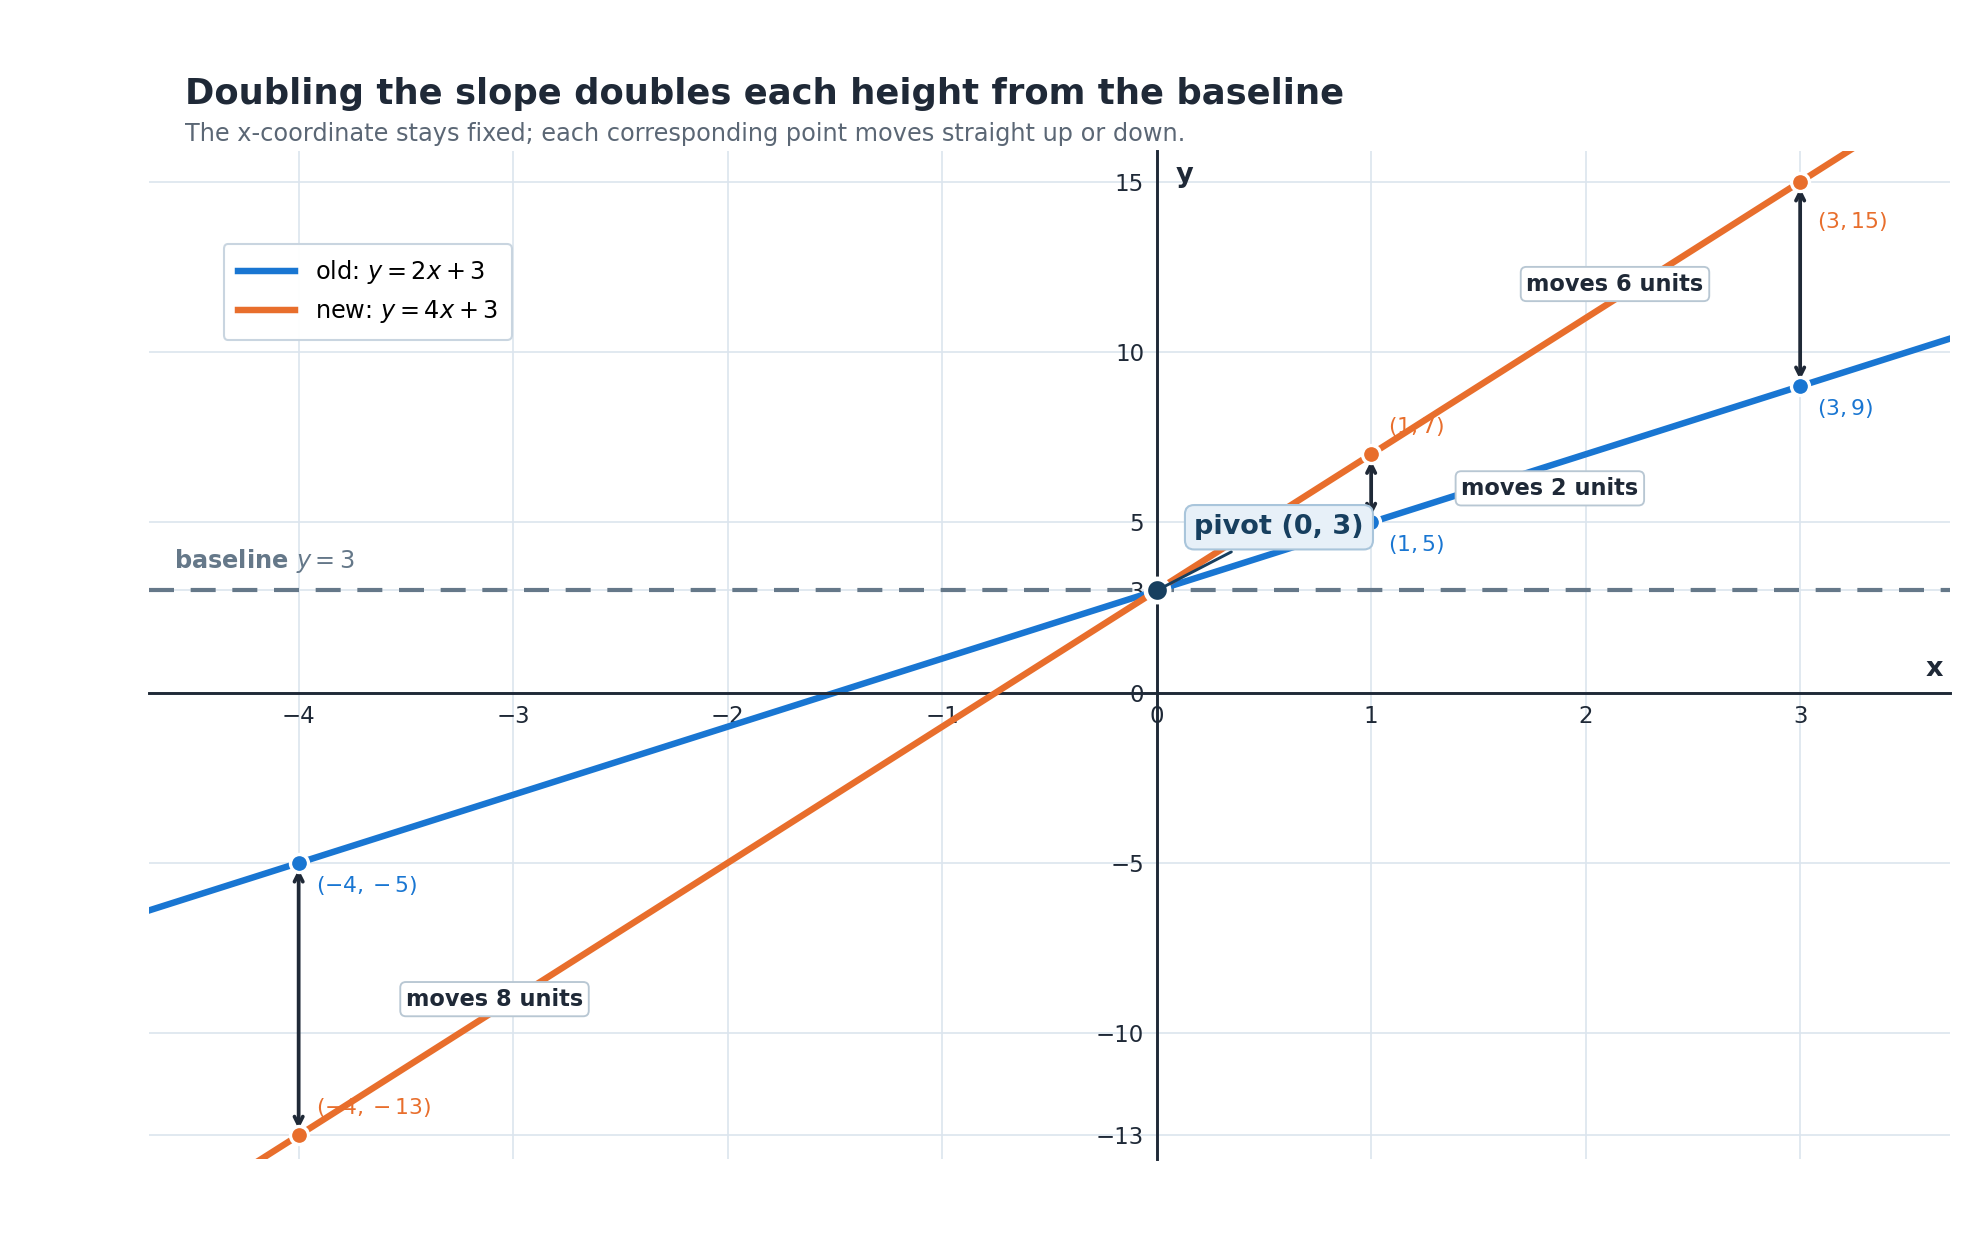
Let us make the stretch concrete. Start with y=2x+3, whose pivot is (0,3), and double the slope to get y=4x+3, so k=4/2=2. Here is what happens to four points, with all heights measured from the line y=3:
x
Old height above y=3
New height above y=3
Vertical distance moved
0
0
0
0
1
2
4
2
3
6
12
6
−4
−8
−16
8
Every new height is exactly double the old one, just as k=2 promises. The distances traveled, though, are all different: the pivot does not budge, the point at x=1 moves 2 units, and the point at x=−4 moves 8 units.
Movement grows in proportion to the distance from the pivot, and that proportional spreading is the signature of a stretch.
Watching a line swing around a fixed point strongly suggests a rotation, but the two descriptions use different point correspondences. A rotation about (0,b) can map one whole line to another, but it generally pairs a point on the old line with a point at a different x-value on the new line. In this lesson, we instead pair points with the same input: the point (1,5) on y=2x+3 becomes (1,7) on y=4x+3. It slides straight up, keeps the same x, and ends up farther from the pivot than it started. Thus this same-input correspondence is a vertical stretch from y=b, not a rotation of corresponding points.
The angles give a second piece of evidence. A line's tilt angle is θ=arctan(m), so let us add 1 to the slope three times in a row and watch what the angle does:
m
Angle with the horizontal
Change from previous row
0
0°
1
45°
+45°
2
≈63.4°
≈+18.4°
3
≈71.6°
≈+8.1°
Equal steps in slope produce shrinking steps in angle. Thus, adding the same amount to the slope does not apply the same rotation angle each time. This does not prevent a particular rotation from mapping one line to another; it distinguishes such a rotation from the same-input vertical stretch used here.
Suppose a delivery service charges C=2d+5 dollars, where d is the distance in miles and $5 is a flat pickup fee. If fuel costs push the per-mile rate to $3, the new model is C=3d+5 — a slope change with k=3/2=1.5.
The pickup fee is the pivot, so a zero-mile order still costs $5 and nothing about that changes. Every charge above the $5 baseline, however, is multiplied by 1.5: a 4-mile trip had $8 of mileage cost and now has $12, while a 20-mile trip jumps from $40 to $60.
The long trips absorb almost the entire increase. That is precisely what "movement grows with distance from the pivot" looks like when it is measured in dollars instead of grid squares.
Here is the whole lesson in three sentences. Changing only m leaves the y-intercept (0,b) fixed, because setting x=0 erases the slope from the equation. Measured from the horizontal line y=b, the new displacement is k=m2/m1 times the old one at every input, so points move vertically by amounts proportional to their distance from the pivot. Pairing points at the same x-value makes the change a vertical stretch, while unequal angle changes show only that equal slope increases are not equal-angle rotations.
Time to put your hands on the slider. In the exercises ahead you will locate the pivot yourself on an adjustable plot, measure how far individual points travel when the slope changes, and compute the scale factor between two slopes. You will finish by writing your own explanation of why this motion is a stretch, backed by displacements you calculated.