Welcome to Slope Changes and Rates of Change! This is the first lesson of the course, so we are starting fresh — though not from zero. In the earlier courses you moved graphs up and down, slid them left and right, and stretched or reflected them. Now we zoom in on a single number that packs a surprising amount of information: the slope m in a linear function.
By the end of this lesson you will read a line's steepness from the size of m, read its direction from the sign of m, and know exactly what happens when m is replaced by −m. That last move looks like a tiny sign flip on paper, but on the graph it produces a clean reflection — and the mirror line is probably not where you would first guess.
Slope as a Promise About Change
A linear function is usually written as
y=mx+b
where b is the output when x=0, and m tells us how fast the output changes. Think of m as a promise: every time the input increases by one unit, the output changes by exactly m. That promise never expires — it holds at x=0, at x=100, and everywhere in between, which is exactly what makes the graph a straight line.
Real situations make this concrete. If a phone plan charges $0.30 per extra gigabyte, then m=0.30; if a candle burns down 2 cm per hour, then m=−2, because the height goes down. Steepness, direction, and reflections are all just different ways of reading that same promise.
Steepness Comes From the Size of m
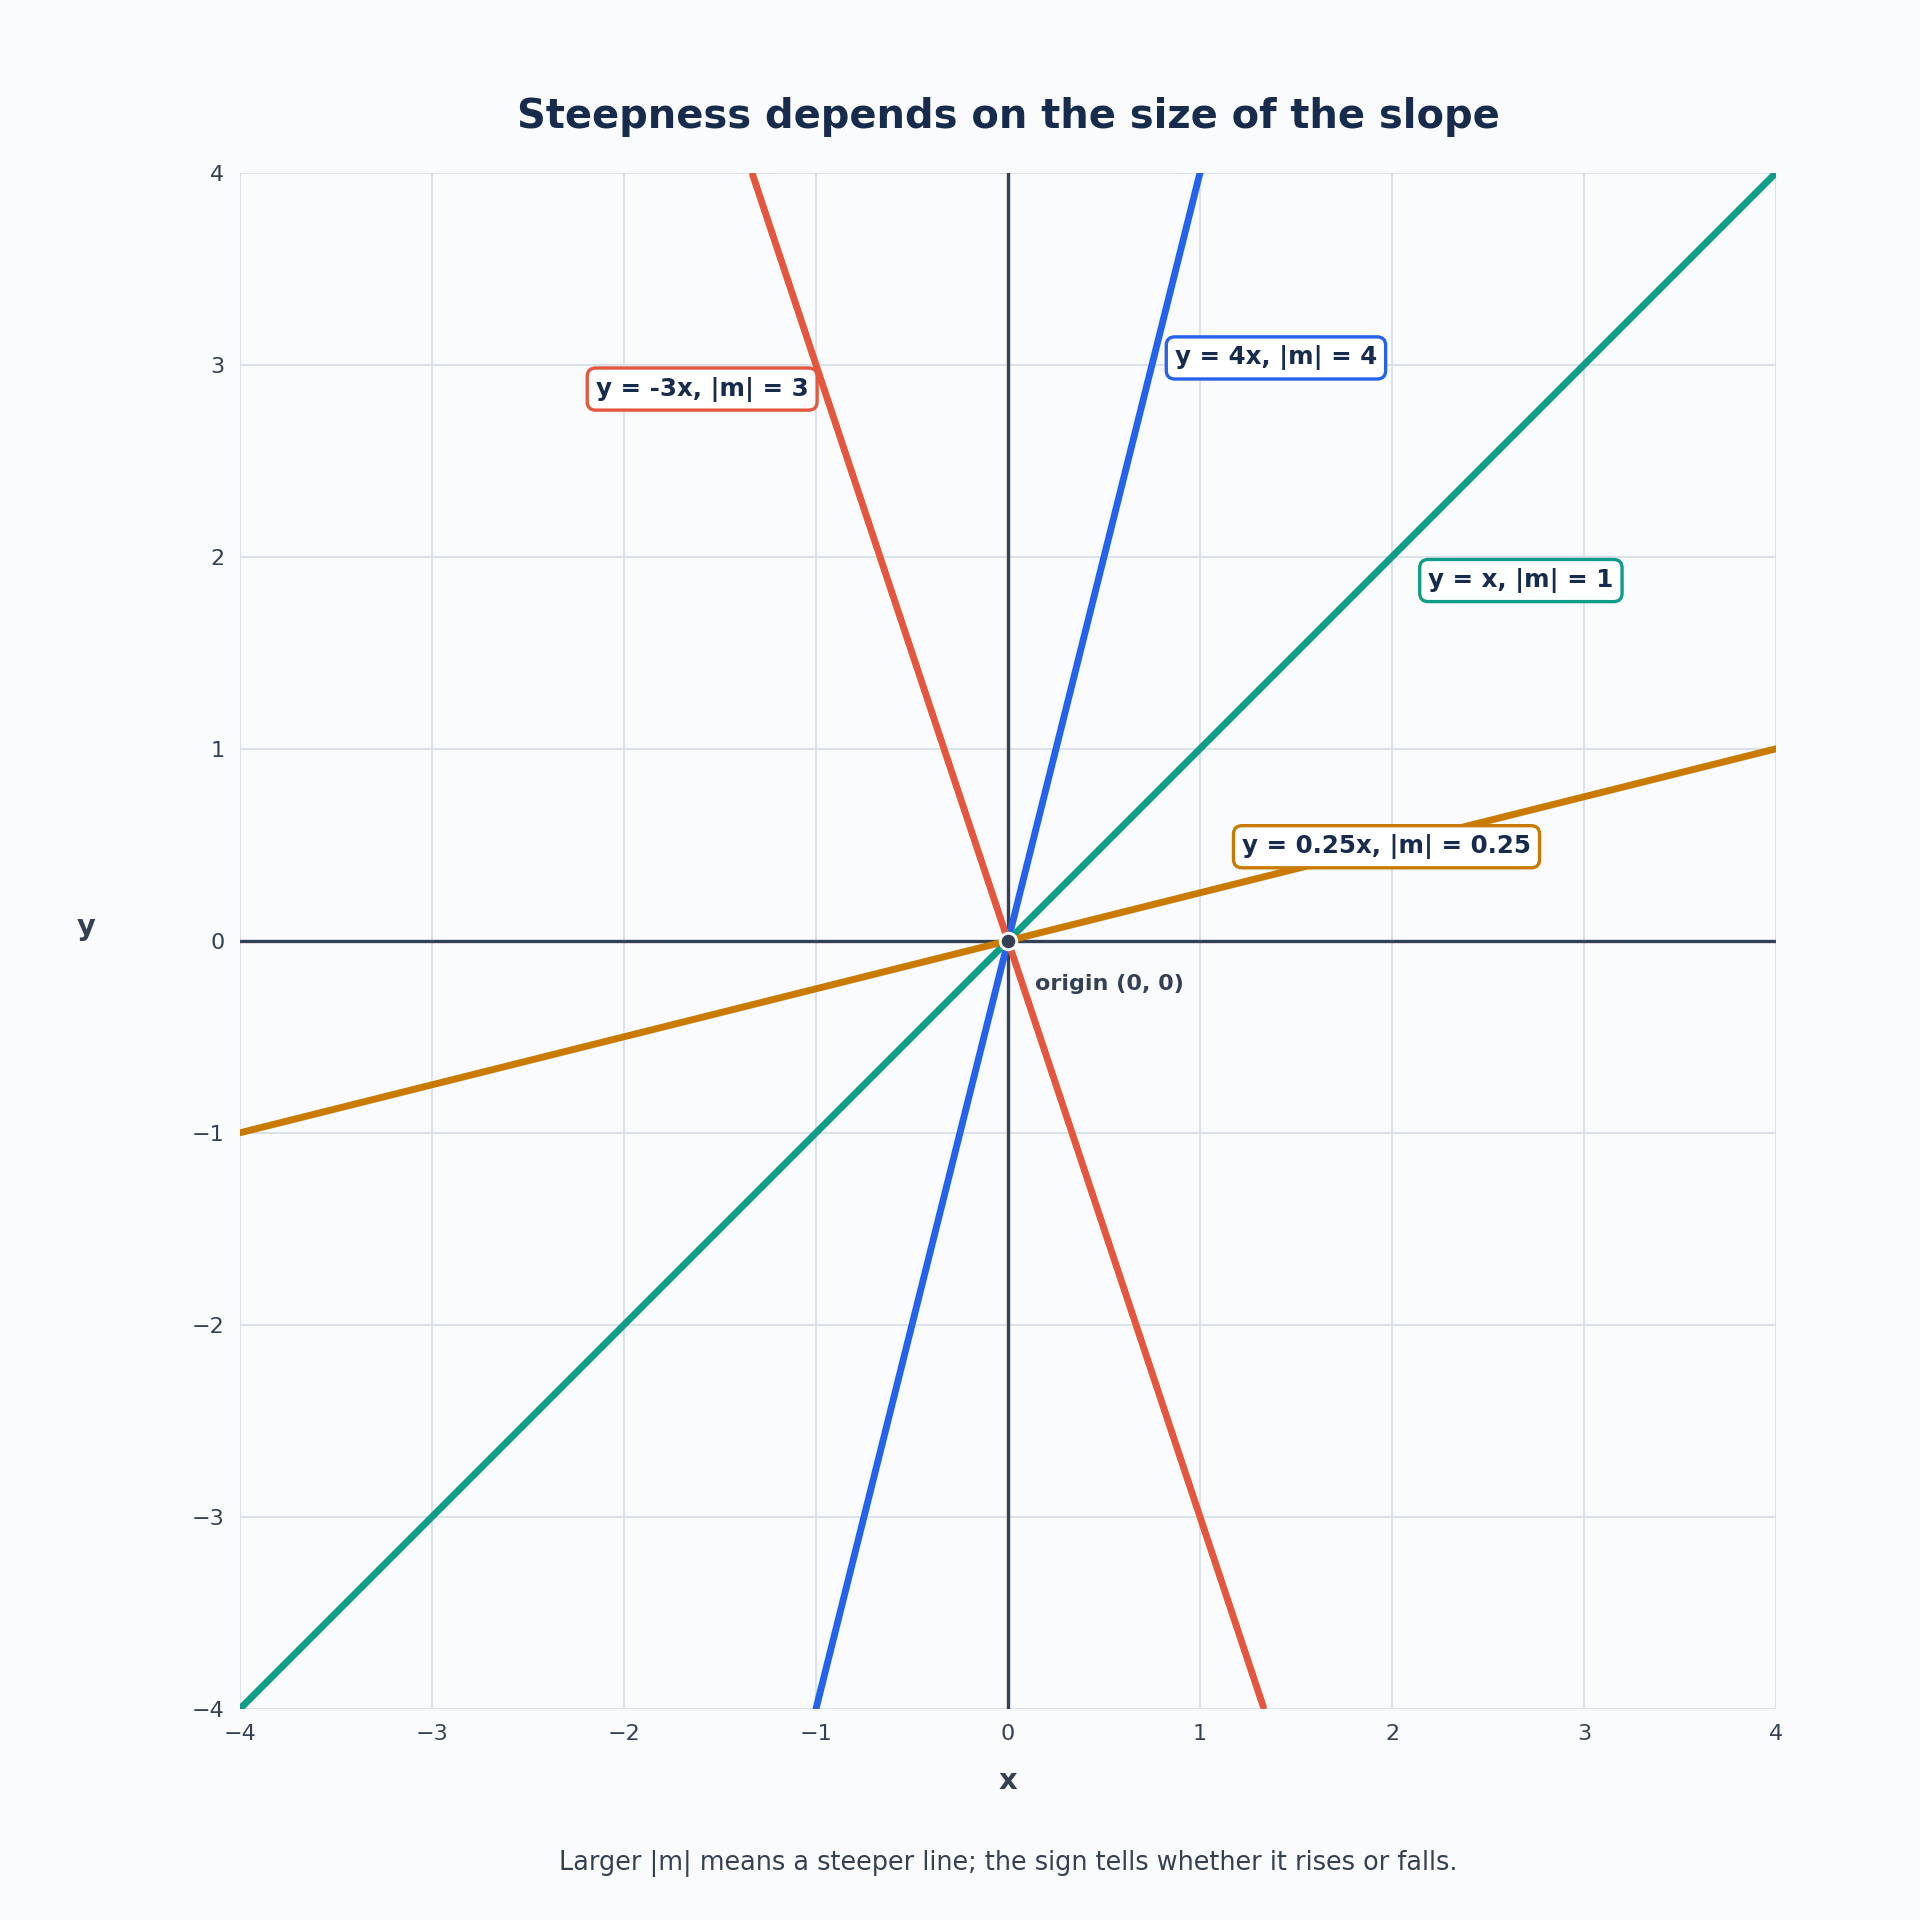
The steepness of a line is controlled by how big m is, ignoring its sign. In symbols, steepness is measured by ∣m∣, the absolute value of the slope: a larger ∣m∣ means the line climbs or drops more sharply, and a smaller ∣m∣ means a gentler line.
Consider these four lines through the origin:
Line
m
∣m∣
Appearance
y=4x
4
4
very steep
y=x
1
1
moderate (a 45° climb)
y=0.25x
0.25
0.25
nearly flat
y=−3x
−3
3
steep, but going down
Ranking these from steepest to flattest gives y=4x, then y=−3x, then y=x, then y=0.25x. Notice that y=−3x is steeper than y=x even though −3 sits far to the left of 1 on the number line. Steepness is about size, not about which number is larger.
Join the 1M+ learners on CodeSignal
Be a part of our community of 1M+ users who develop and demonstrate their skills on CodeSignal
While the size of m sets the steepness, the sign of m sets the direction, always read from left to right across the graph:
m>0: the line rises. Each one-unit step right lifts the output by m.
m<0: the line falls. Each one-unit step right lowers the output by ∣m∣.
m=0: the line stays level. The function collapses to the constant y=b, a horizontal line.
Putting size and sign together lets us describe any line in one short phrase. For m=4 we say "rises steeply"; for m=0.25, "rises gently"; for m=−3, "falls steeply"; and for m=0, "stays level." Two words — one for sign, one for size — and the line is described.
A visual impression is useful, but slope also hands us an exact number, and it is worth being fluent in stating it. The rule is that increasing x by 1 changes y by m:
f(x+1)−f(x)=m
Let us test this with f(x)=−43x+5. At x=0 we get f(0)=5, and at x=1 we get f(1)=4.25, so the change is 4.25−5=−0.75 — exactly the slope. The precise statement is therefore: the output decreases by 0.75 for every one-unit increase in the input.
Fractional slopes are no harder than whole ones, and the phrase "per one unit" never changes. A slope of 52 simply means the output goes up by 0.4 each step; a slope of −6 means it drops by 6 each step.
Now for the main event. Suppose we keep b fixed and swap the slope's sign, comparing
y=mx+bandy=−mx+b
Two things happen at once. The steepness is untouched, since ∣m∣=∣−m∣, and the direction reverses, so a rising line becomes a falling line of the same sharpness. The two lines also always meet at the y-intercept (0,b), because substituting x=0 gives b in both formulas no matter what m is.
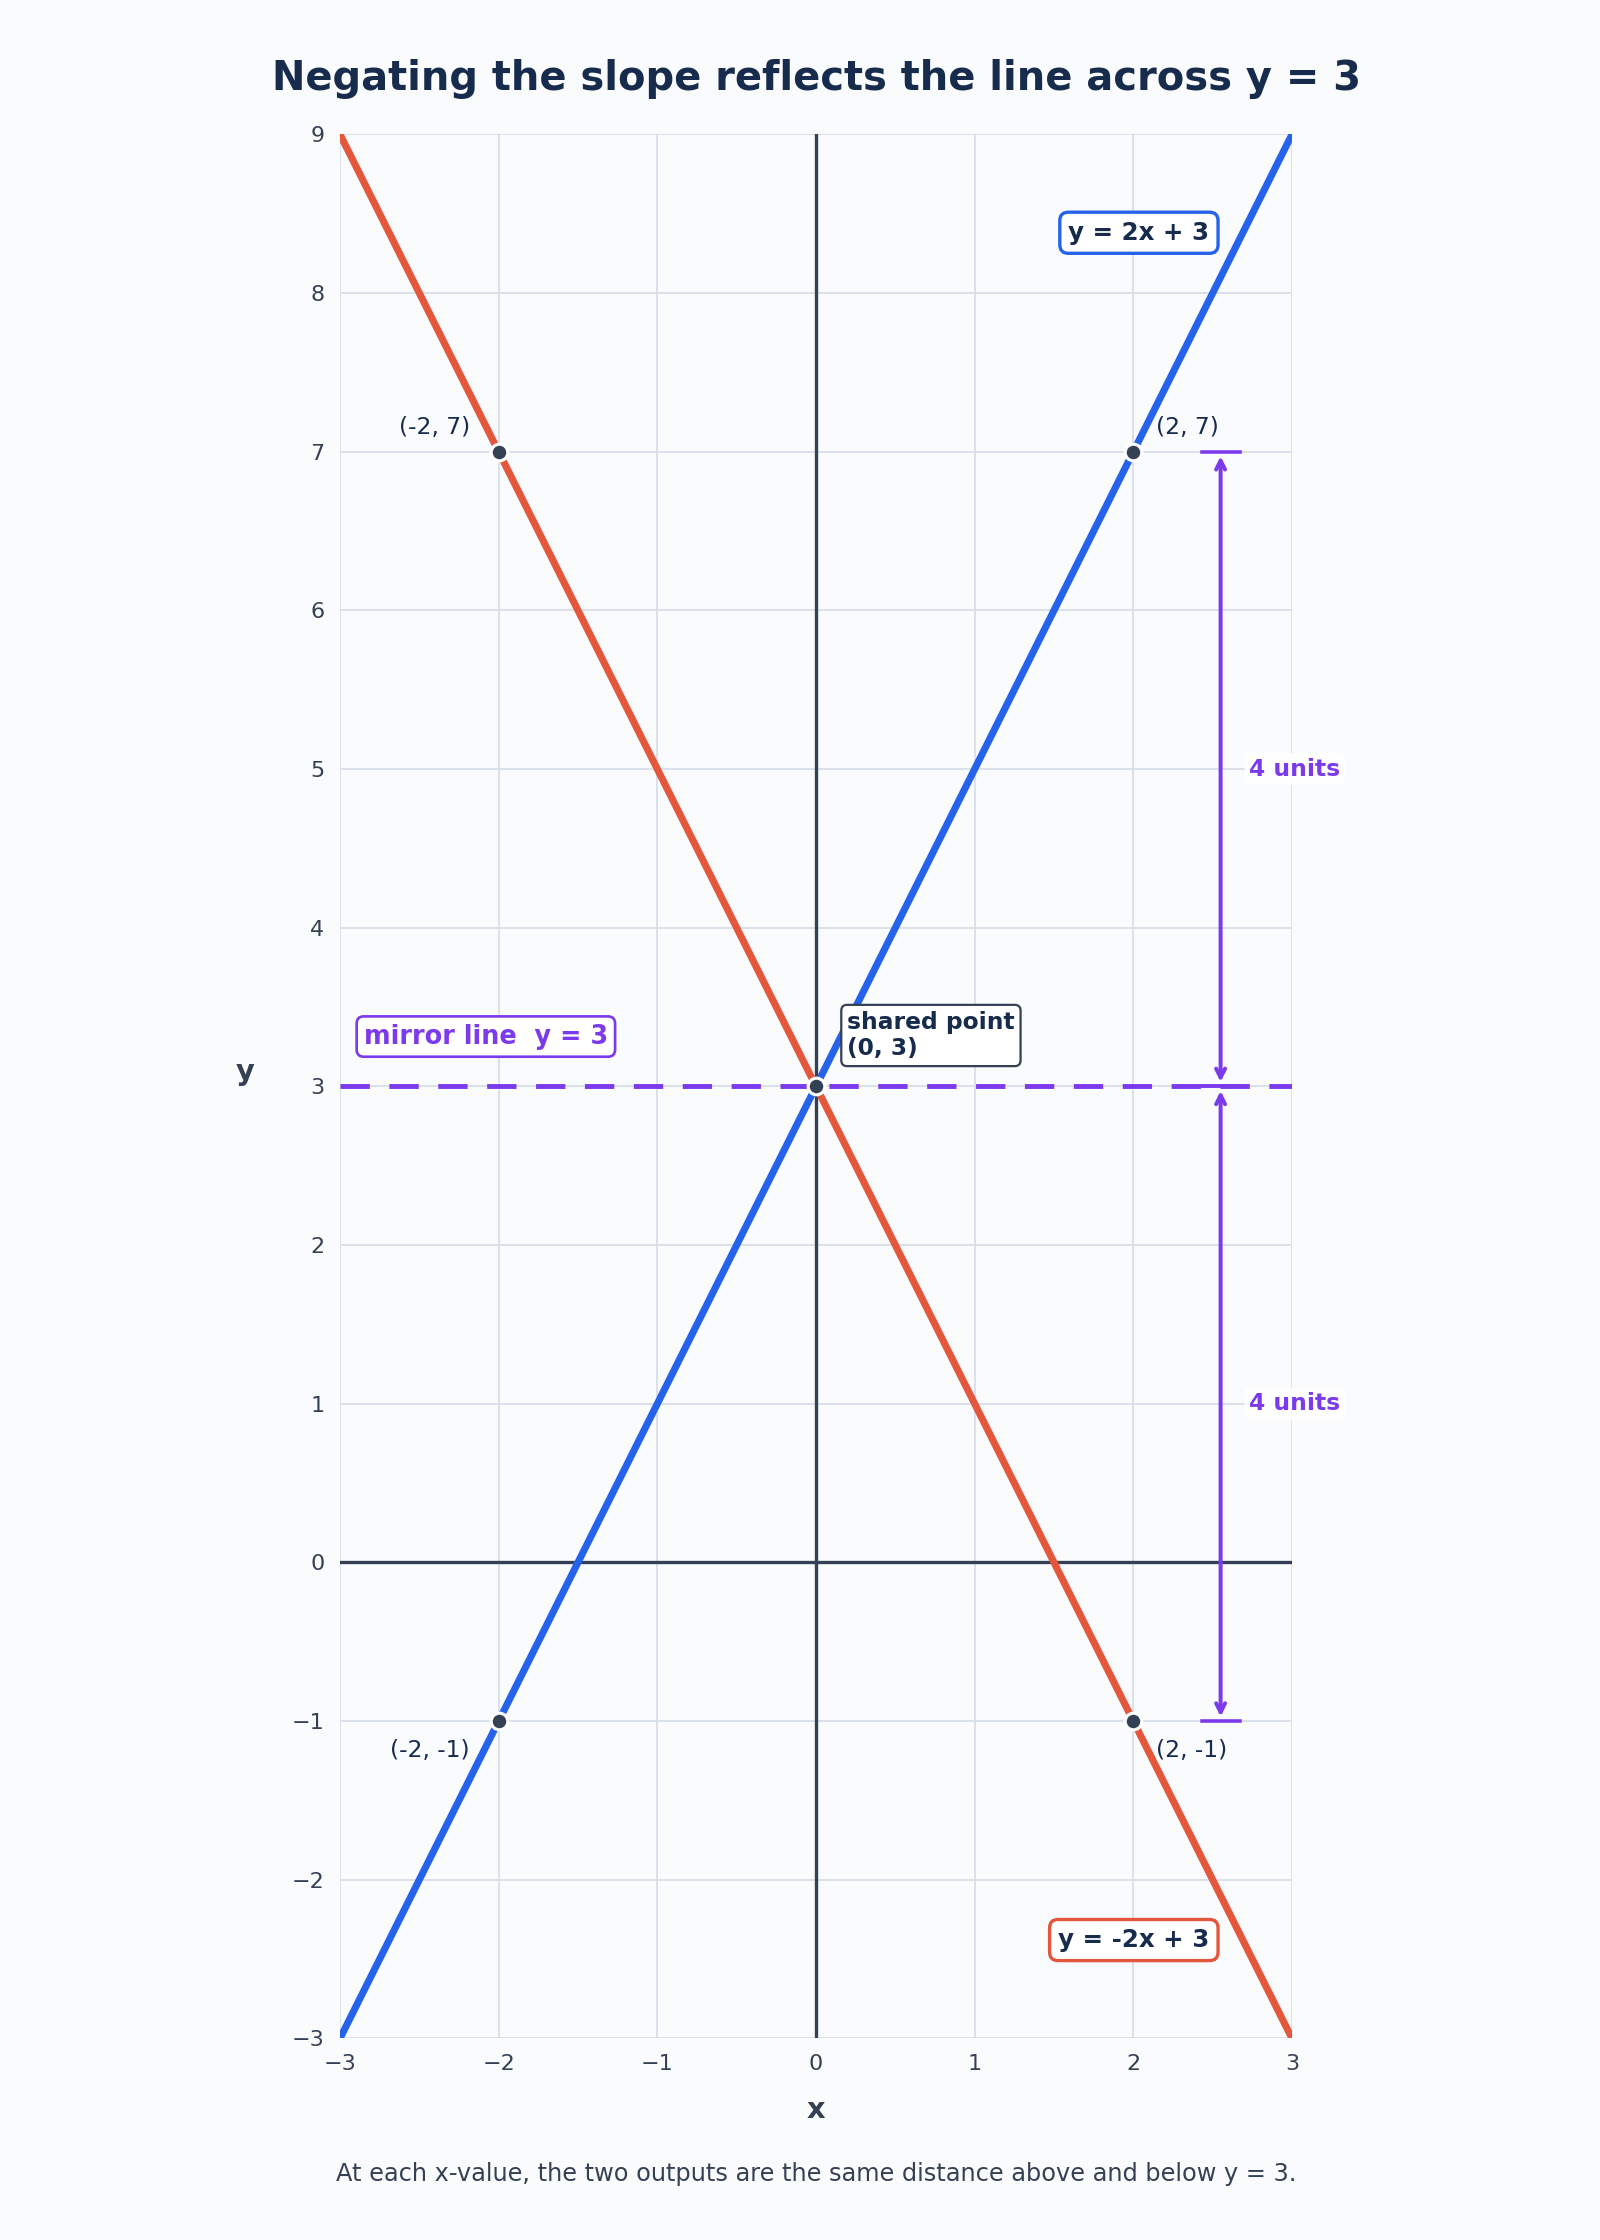
Here is the key question: where is the mirror? Take m=2 and b=3, so we compare y=2x+3 with y=−2x+3.
x
y=2x+3
y=−2x+3
Distance from y=3
−2
−1
7
4 below and 4 above
0
3
3
both on the line
2
7
−1
4 above and 4 below
At every input, one line sits as far above the height 3 as the other sits below it. The mirror is therefore the horizontal line y=b, the line through the y-intercept — not the x-axis.
It is tempting to call this a reflection across the x-axis, and there is a good reason it feels right: when b=0, the line y=bis the x-axis, so both descriptions agree in that special case. But as you saw in the earlier course on reflections, flipping across the x-axis turns f(x) into −f(x), which here gives −(mx+b)=−mx−b. That flips the intercept as well, and the intercept is exactly what we wanted to keep.
The algebra settles it. Measure each line by its displacement from the height b:
(mx+b)−b=mxand(−mx+b)−b=−mx
The two displacements are exact opposites at every x: same distance from y=b, opposite sides, with (0,b) never moving. That is the definition of a reflection across the horizontal line y=b.
Suppose a job pays according to P=15h+40, where h is hours worked and P is dollars, with $40 as a guaranteed show-up bonus. Its slope-negated partner, P=−15h+40, tells a very different story — say, a $40 prepaid balance being drained at $15 per hour.
Both lines start at (0,40) and share a steepness of 15 dollars per hour, but one climbs while the other drops. Drawn together, they form a sideways "V" opening from (0,40), mirrored across the horizontal line P=40 rather than the h-axis — the $40 head start is common to both, so it is the level the reflection balances around.
Comparing rates in context then comes down to comparing sizes. A rate of 15 beats a rate of 12 by $3 per hour, no matter what starting bonus either job offers.
You now have a compact toolkit for reading a line. The size ∣m∣ gives steepness and lets you rank lines from flattest to steepest, the sign of m says whether the line rises, falls, or stays level, and the statement "the output changes by m per one-unit increase in the input" converts that picture into an exact number.
Replacing m with −m preserves both the steepness and the point (0,b), reversing direction through a reflection across the horizontal line y=b. In the exercises ahead you will rank lines by steepness, state per-unit changes for fractional and negative slopes, match slopes to their descriptions, and flip a line on the plot to locate that mirror yourself.