Strength of a Relationship
Introduction
Welcome back to Seeing Relationships in Data! This is the sixth of seven lessons in the course, which means you are nearly at the finish line. So far, you have learned to recognize paired data, understand what association means, read and build scatter plots, and classify the direction of a relationship as positive, negative, or having no clear trend. In this lesson, we turn to a new and equally important question: how strong is the relationship?
By the end of this lesson, you will be able to look at a scatter plot and judge whether the association between two variables is strong, moderate, or weak. More importantly, you will learn to treat strength as its own dimension, completely separate from both the direction and the steepness of the pattern.
A Real-World Warm-Up
Imagine two weather forecasters. For Forecaster A, the relationship between what they predict and what actually happens is very consistent. If you know their prediction, you can determine the actual temperature with high confidence because the results always hover tightly around a specific trend. For Forecaster B, the results are much more erratic. Even if their predictions generally go up when it gets warmer, the actual temperatures are scattered widely—sometimes much higher than the trend, sometimes much lower.
That tightness is exactly what we mean by strength in a relationship. When paired data points stick closely to an overall pattern, the relationship is strong. When they scatter widely around that pattern, the relationship is weak. The pattern itself can slope up, slope down, or be steep or gentle — strength is about how reliably the data follows whatever pattern exists.
Tightness Around the Trend
The core idea of strength is straightforward: strength describes how closely the points in a scatter plot cluster around the overall trend. Picture an imaginary line or curve that captures the general direction of the data. If most points hug that line tightly, the relationship is strong. If the points form a loose, wide cloud around the line, the relationship is weak.
Here is a quick way to think about it:
- Strong relationship: The points form a narrow band. Knowing one variable gives you a good guess of the other.
- Moderate relationship: There is a visible trend, but the points spread noticeably around it.
- Weak relationship: The cloud of points is so wide that the trend is hard to see, and knowing one variable barely helps you predict the other.
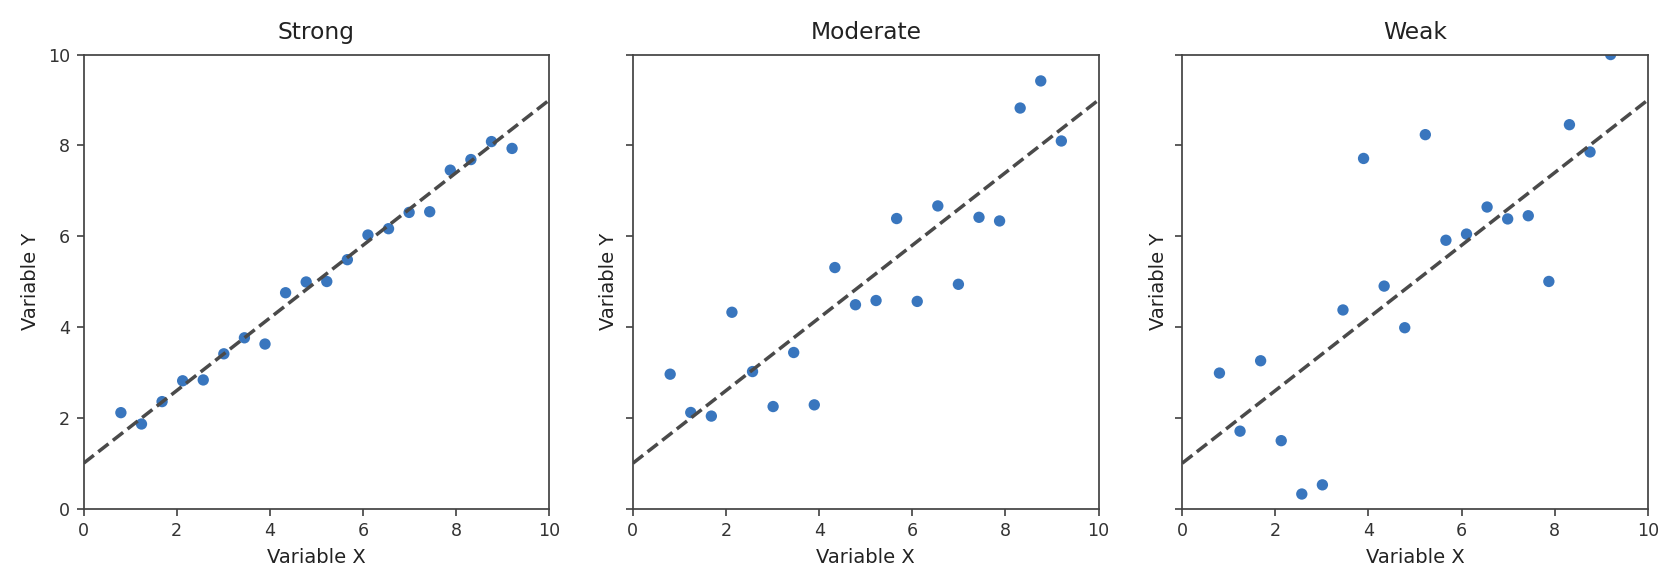
Notice that we are not looking at which way the trend goes or how steeply it rises or falls. We are only asking: how much do the points wander away from the trend?