Form of a Relationship
Introduction
Welcome to the seventh and final lesson of Seeing Relationships in Data! Over the course of this journey, you have built an impressive set of skills: recognizing paired data, understanding association, reading and building scatter plots, classifying the direction of a relationship, and judging its strength. Now we add one more dimension that ties everything together: the form of a relationship.
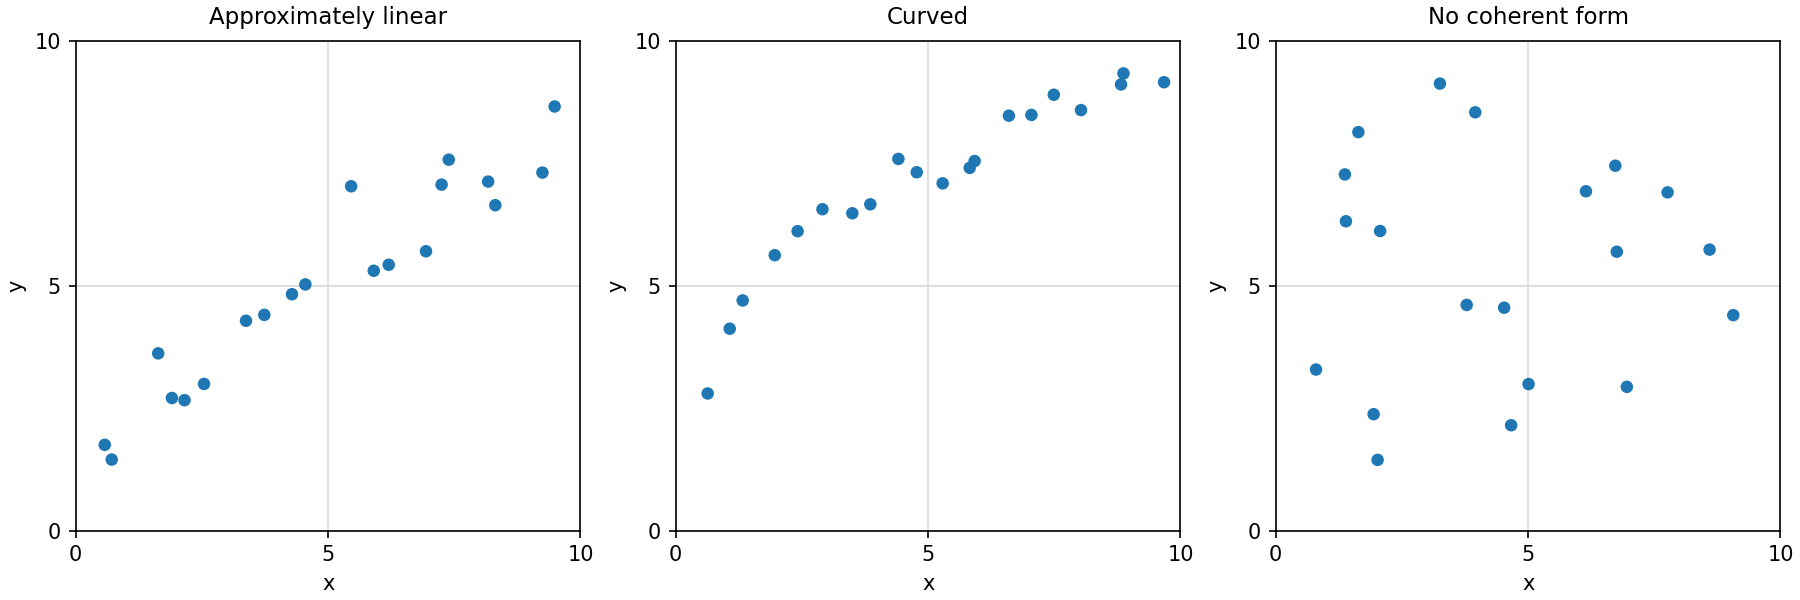
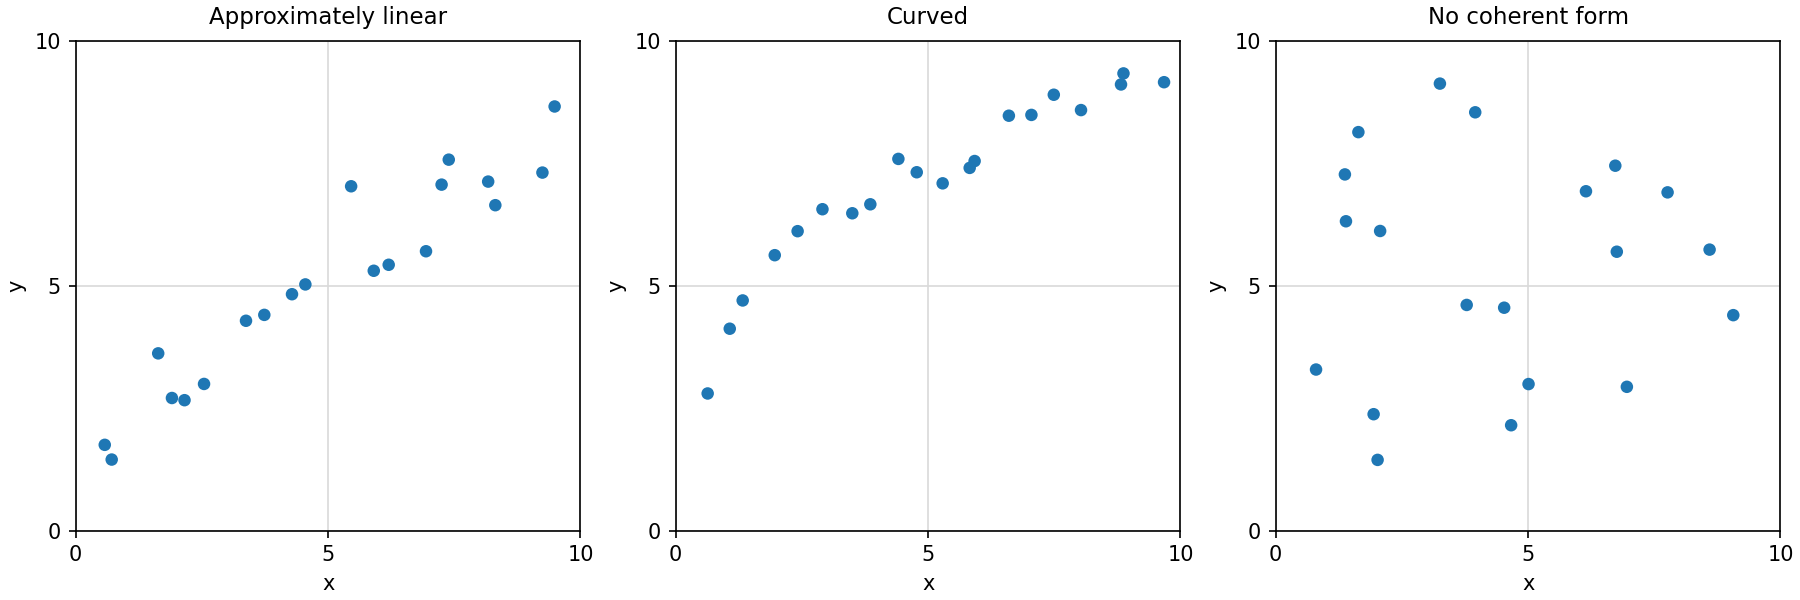
In this lesson, you will learn to look at a scatter plot and decide whether the overall pattern is approximately linear, curved, or has no coherent form at all. This distinction matters because it determines whether a straight-line summary is a fair representation of the data or a misleading one. Recognizing form will become essential when you move on to standard methods like Pearson correlation and simple linear regression in later courses.
Beyond Direction and Strength
You already know how to describe a scatter plot's direction (positive, negative, or neither) and its strength (tight clustering versus loose spread). But neither of those captures the shape the data traces out.
Think of it this way: two scatter plots can both show a strong, positive association, yet one might follow a straight path while the other bends into a curve. Direction and strength alone cannot tell them apart. Form is the dimension that answers a different question entirely: What shape does the overall pattern take?
Linear Patterns
A scatter plot has a linear (or approximately linear) pattern when the points cluster around an imaginary straight line. The trend does not need to be perfect — real data almost never falls exactly on a line. What matters is that the general drift of the points looks like it could be reasonably captured by a single straight line, with the points scattering more or less evenly on both sides.
Here are a few hallmarks of a linear pattern:
- As you scan the plot from left to right, the trend does not bend or change direction.
- The rate at which changes per unit of stays roughly the same across the entire range.
- A straight line placed through the middle of the cloud would sit close to most of the points without systematically missing sections of the data.
A classic real-world example is the relationship between a person's height and their arm span. Taller people tend to have longer arm spans, and the increase is fairly steady — it does not speed up or slow down dramatically at either end.