Direction of a Relationship
Introduction
Welcome back to Seeing Relationships in Data! You have reached lesson five of seven, so the finish line for this course is well within sight. So far, you have learned to recognize paired data, explored what association means, practiced reading scatter plots, and built your own from a table of values. Each of those skills was a building block, and now we start using the scatter plots we can read and build to describe the patterns they reveal. In this lesson, we focus on one important feature of any scatter-plot pattern: the direction of the relationship between two variables.
Stepping Back from the Dots
In the previous lesson, we zoomed in on individual dots, placing each one carefully at the right coordinates. Now we do the opposite: we step back and look at the scatter plot as a whole.
Think of it like looking at a hillside. Up close, you notice rocks, patches of grass, and uneven ground. But if you step back, you can see whether the hillside generally slopes up or down. That overall slope is exactly what we mean by the direction of a relationship. Our job in this lesson is to learn how to name that slope and say what it tells us about the two variables.
Positive Direction
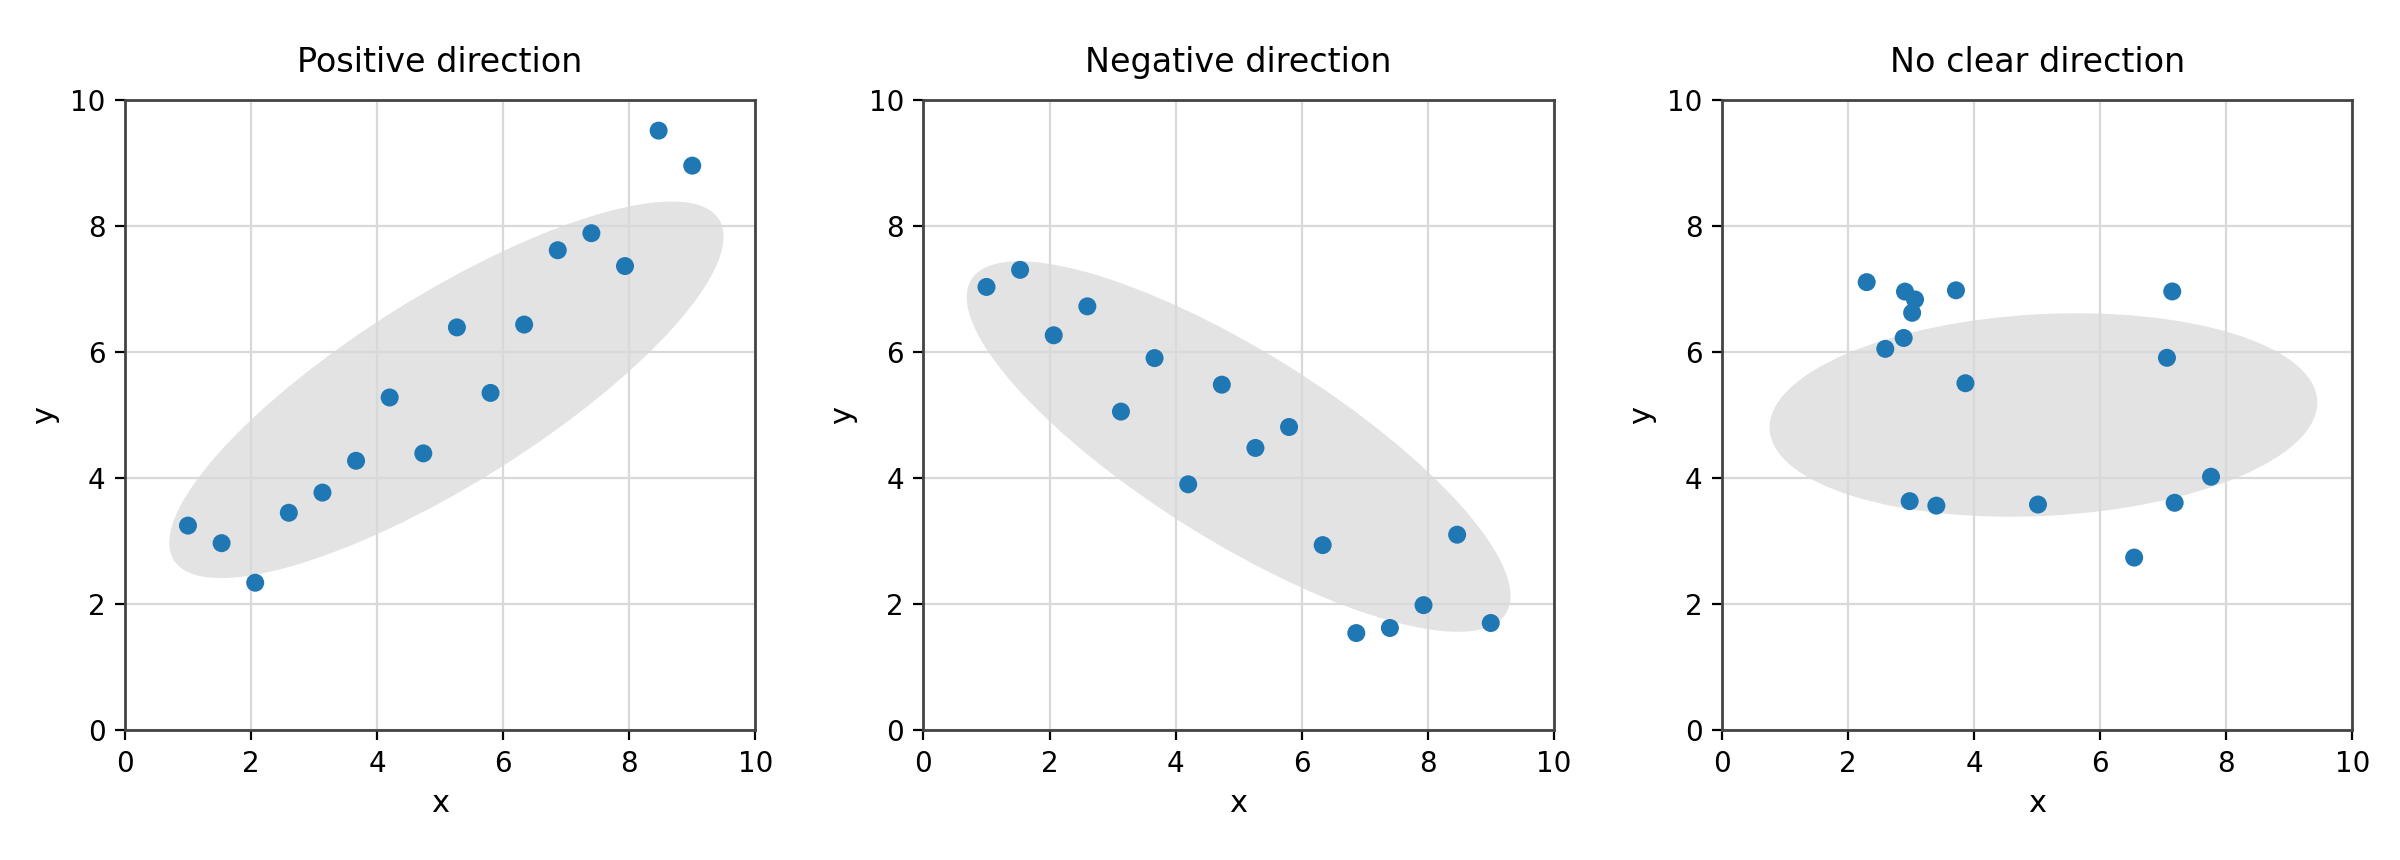
A scatter plot shows a positive direction when the dots tend to rise as we scan from left to right. In other words, as the values of increase, the values of also tend to increase. The two variables move in the same direction.
The study-time-and-test-score plot from the previous lesson is a good example. Students who studied more hours generally earned higher scores, so the dots drifted upward from left to right. That upward drift is a positive direction.
Here are a few more everyday pairs that typically show a positive direction:
- Height and shoe size: taller people tend to have larger feet.
- Hours worked and total pay: more hours usually means a bigger paycheck.
- A child's age and vocabulary size: older children tend to know more words.
In each case, when one variable goes up, the other tends to go up as well.
Negative Direction
A scatter plot shows a negative direction when the dots tend to fall as we scan from left to right. As increases, tends to decrease. The two variables move in opposite directions.
Picture a scatter plot with a car's age (in years) on the horizontal axis and its resale value (in dollars) on the vertical axis. Brand-new cars sell for the most; as a car gets older, its resale value generally drops. The dots would slope downward from left to right, which is a negative direction.
A few more pairs that typically trend negative:
- Outside temperature and home heating cost: warmer days tend to bring lower heating bills.
- Distance from a city center and noise level: farther out usually means quieter surroundings.
In each case, when one variable goes up, the other tends to go down.