Building a Scatter Plot
Introduction
Welcome back to Seeing Relationships in Data! This is the fourth of seven lessons in the course, which means you have crossed the halfway mark — nice work. In the first three lessons, you learned to recognize paired data, explored what association means, and practiced reading scatter plots that someone else had already built. Now it is time to take the wheel. In this lesson, you will learn how to build a scatter plot from scratch, starting with a table of paired values and ending with a clear, well-labeled visual display. Along the way, you will choose appropriate axes, set sensible scales, and plot each case as a single point.
From Reading to Building
Think about the difference between reading a recipe and actually cooking a meal. When you read a recipe, you follow along and understand each step; when you cook, you decide the timing, measure the ingredients, and make adjustments as you go. Building a scatter plot works the same way. In the previous lesson, we interpreted choices someone else had already made — which variable goes on which axis, where the scale starts, and what each dot means. Now we make every one of those decisions ourselves.
The good news is that the building blocks are exactly the components we already know how to read: axis labels, units, scales, and individual points. The difference is simply the direction of the work. Instead of looking at a finished plot and extracting information, we start with raw data and create the picture.
Starting from a Data Table
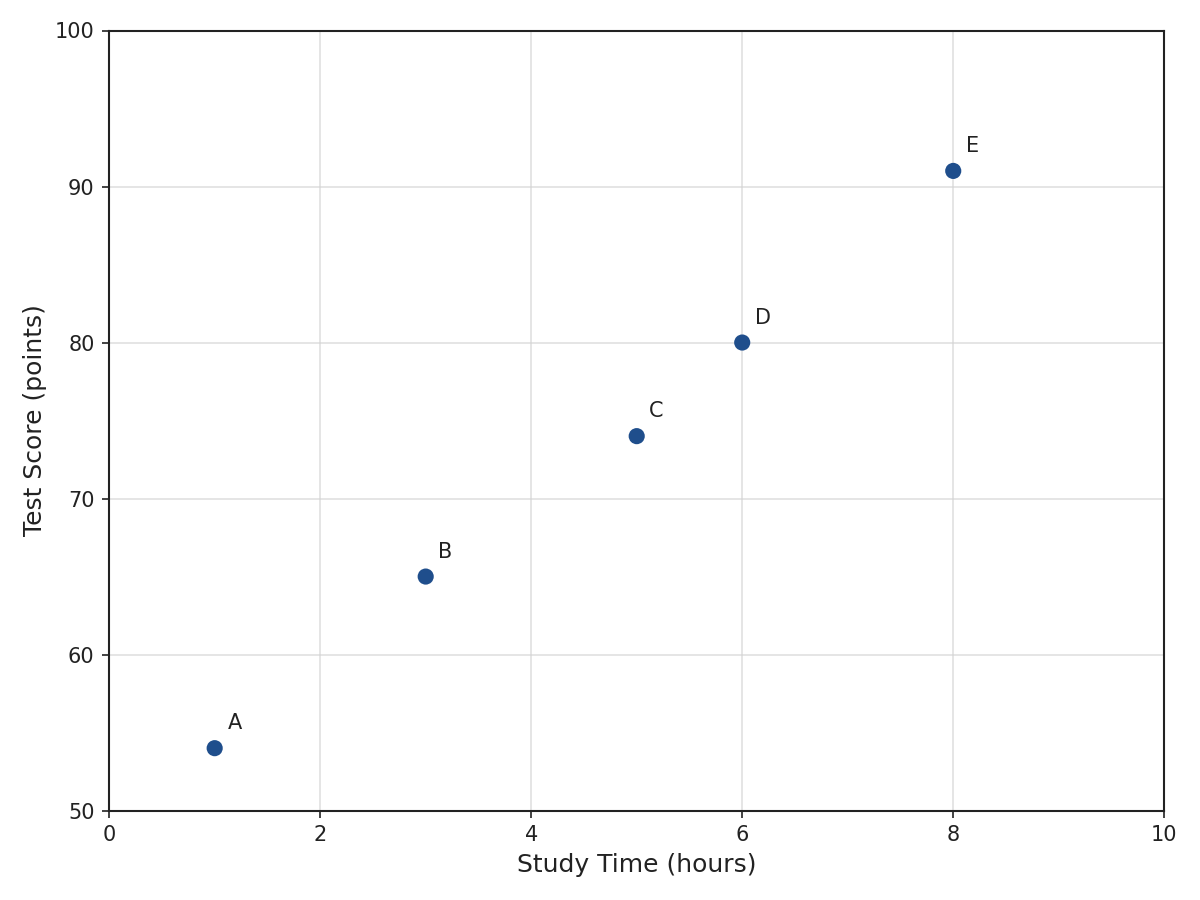
Every scatter plot begins with a table of paired data — two quantitative measurements recorded on the same case. Here is a small data set we will use as a running example throughout this lesson:
| Student | Study Time (hours) | Test Score (points) |
|---|---|---|
| A | 1 | 54 |
| B | 3 | 65 |
| C | 5 | 74 |
| D | 6 | 80 |
| E | 8 | 91 |
Each row represents one student, and each student has two measurements: how long they studied and the score they earned. Our task is to turn these five rows into five dots on a properly set-up scatter plot. Before we place a single dot, though, we need to make some important setup decisions — starting with the axes.
Labeling the Axes
The first step is to assign each variable to an axis and label it clearly. Each axis must show the variable name and its unit of measurement. For our example, we place Study Time (hours) on the horizontal axis and Test Score (points) on the vertical axis.
A label like "Study Time (hours)" is far more informative than just "hours" or, worse, no label at all. Remember from the previous lesson how a plot without complete labels leaves the reader guessing? When you are the one building the plot, you have the power to prevent that confusion. Make each label specific enough that someone seeing the plot for the first time can immediately understand both axes without needing any extra explanation.