Reading a Scatter Plot
Introduction
Welcome back to Seeing Relationships in Data! This is the third of seven lessons in the course, and you are making great progress. So far, you have learned how to recognize paired data and how to judge whether two variables are likely associated. The natural next question is: how do we actually look at paired data to spot those patterns? In this lesson, we will explore the most common visual tool for that job — the scatter plot. By the end, you will be able to read any scatter plot with confidence, pulling precise information from its axes, scales, labels, and individual points.
Why We Need a Picture
Association, as you learned last time, means that two variables tend to change together across many cases. Reasoning and everyday knowledge can help us guess whether an association is plausible, but what happens when we have an actual data set with dozens or hundreds of cases sitting in a table? Scanning rows of numbers one pair at a time makes it very hard to see a pattern — or to confirm that no pattern exists.
A scatter plot solves this problem by turning each row of paired data into a single dot on a graph. Instead of reading through a table, we can see the entire data set at a glance, and patterns jump out visually. Before we can interpret those patterns, though, we need to know how to read the plot itself — and that is our focus today.
The Anatomy of a Scatter Plot
Every scatter plot is built from a few standard pieces. Let's walk through them using an example: a scatter plot that displays data about used cars, with mileage (thousands of miles) on the horizontal axis and price (thousands of dollars) on the vertical axis.
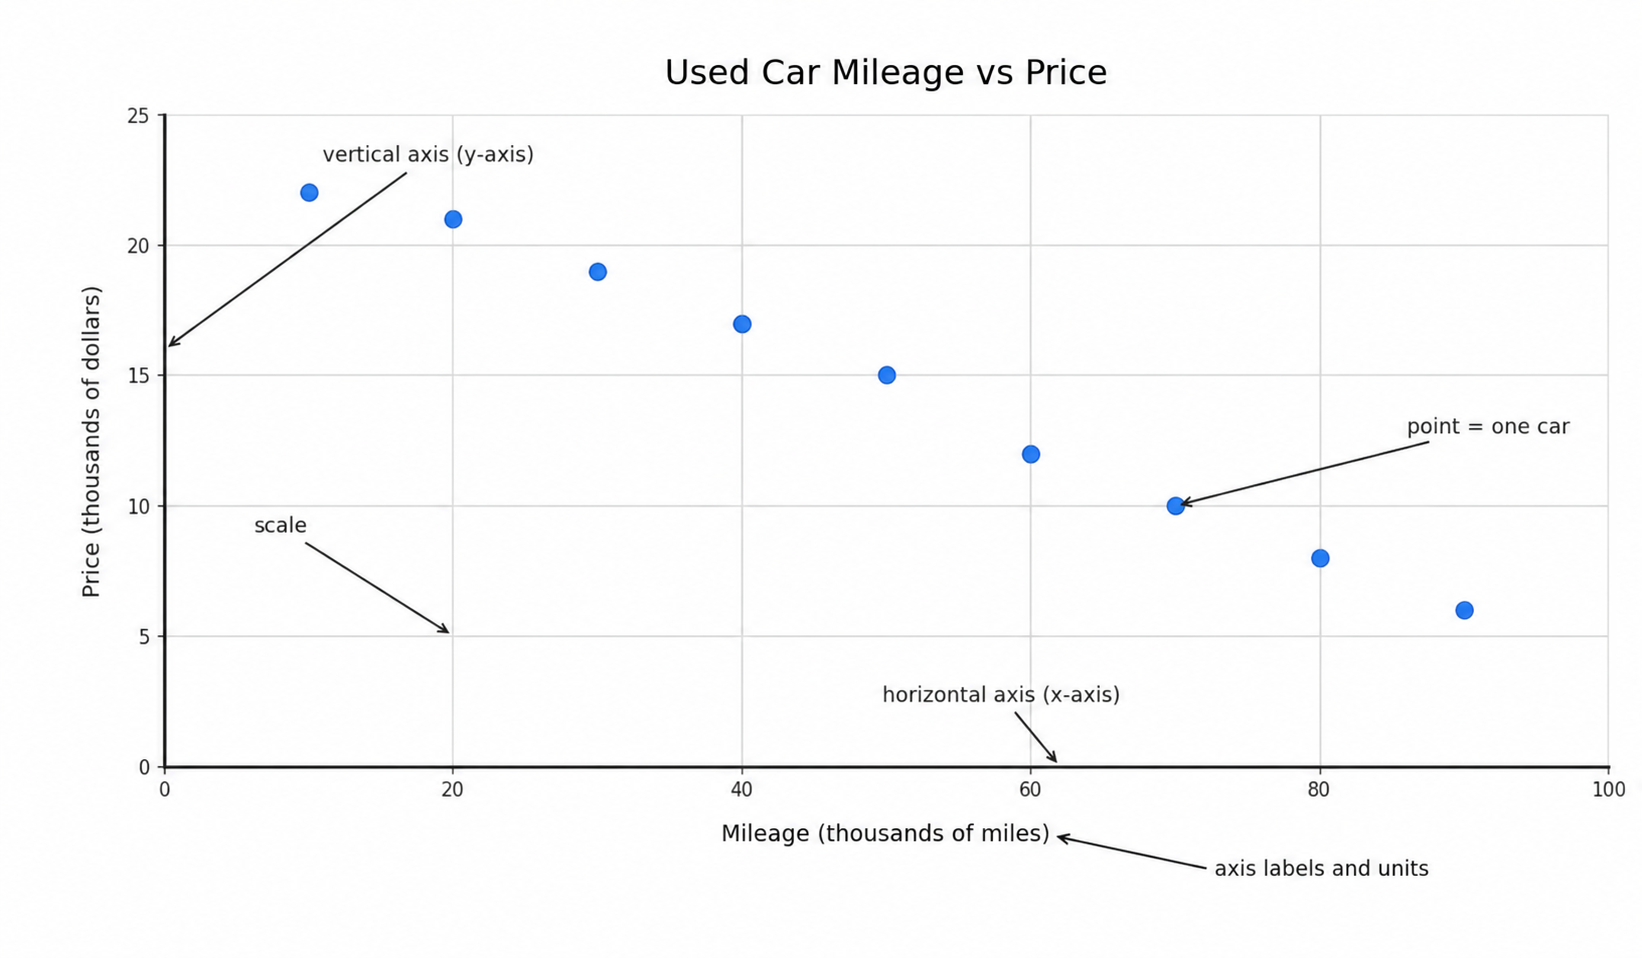
Here are the key components to look for:
- Horizontal axis (x-axis): Runs left to right across the bottom. In our example it shows mileage in thousands of miles.
- Vertical axis (y-axis): Runs bottom to top along the left side. Here it shows price in thousands of dollars.
- Axis labels and units: Each axis has a clear label naming the variable and its unit of measurement. Without units, the numbers on the axes are meaningless.
- Scale and gridlines: The evenly spaced numbers along each axis define how values are divided up. Gridlines or tick marks help us read values more precisely.
- Points (dots): Each dot on the plot represents one case — in this example, one specific used car.
Whenever you encounter a new scatter plot, make it a habit to read the axis labels and units before looking at any dots. This small step prevents misreading the data later.
