Welcome back to Representing and Interpreting Solutions! This is lesson two of four in the course, so we are making great progress. In the previous lesson, we learned how to write inequality solutions using interval notation — parentheses, brackets, and infinity. Now we are going to connect that skill with a visual tool we have been using since the very beginning of our learning path: the number line. By the end of this lesson, you will be able to look at a number-line graph and write its interval notation, and just as comfortably, read interval notation and sketch the correct number-line graph yourself.
Two Representations, One Solution
A number-line graph and an interval notation expression are two ways of describing the exact same set of values. Think of it like a street address and a pin on a map — different formats, same location. Our job in this lesson is to move fluently between these two formats without losing any detail.
As you may recall, a number-line graph uses circles and shading to show which values satisfy an inequality. An open circle means the endpoint is not included, while a closed (filled) circle means it is included. The shaded region shows every value that belongs to the solution set.
Interval notation captures the same information in written form. A parenthesis signals "not included" (matching an open circle), and a bracket signals "included" (matching a closed circle). Infinity symbols indicate that the solution extends without bound in one direction and always pair with a parenthesis, since infinity is never a reachable value.
Reading a Number-Line Graph
Before we convert anything, let's make sure we can quickly read the three key pieces of information that every single-inequality number-line graph provides:
The endpoint value — the number where the circle sits.
The endpoint type — open circle (excluded) or closed circle (included).
The shading direction — left toward −∞ or right toward +∞.
For example, picture a closed circle at 3 with shading extending to the left. That tells us every value less than or equal to 3 is part of the solution, corresponding to x≤3. Once you can identify these three features at a glance, translating to interval notation becomes a simple, repeatable process.
Join the 1M+ learners on CodeSignal
Be a part of our community of 1M+ users who develop and demonstrate their skills on CodeSignal
With those three pieces of information in hand, writing the interval follows a clear set of steps:
Check the circle type. A closed circle means use a bracket; an open circle means use a parenthesis.
Check the shading direction. Shading to the left tells us the interval extends toward −∞. Shading to the right tells us it extends toward +∞.
Write the interval from left to right, always placing the smaller quantity (or −∞) first.
Remember that infinity always pairs with a parenthesis, never a bracket. The table below summarizes the full symbol mapping:
Number-Line Feature
Interval Symbol
Open circle at a
Parenthesis at a
Closed circle at a
Bracket at a
Shading to the left
−∞ on the left side
Shading to the right
+∞ on the right side
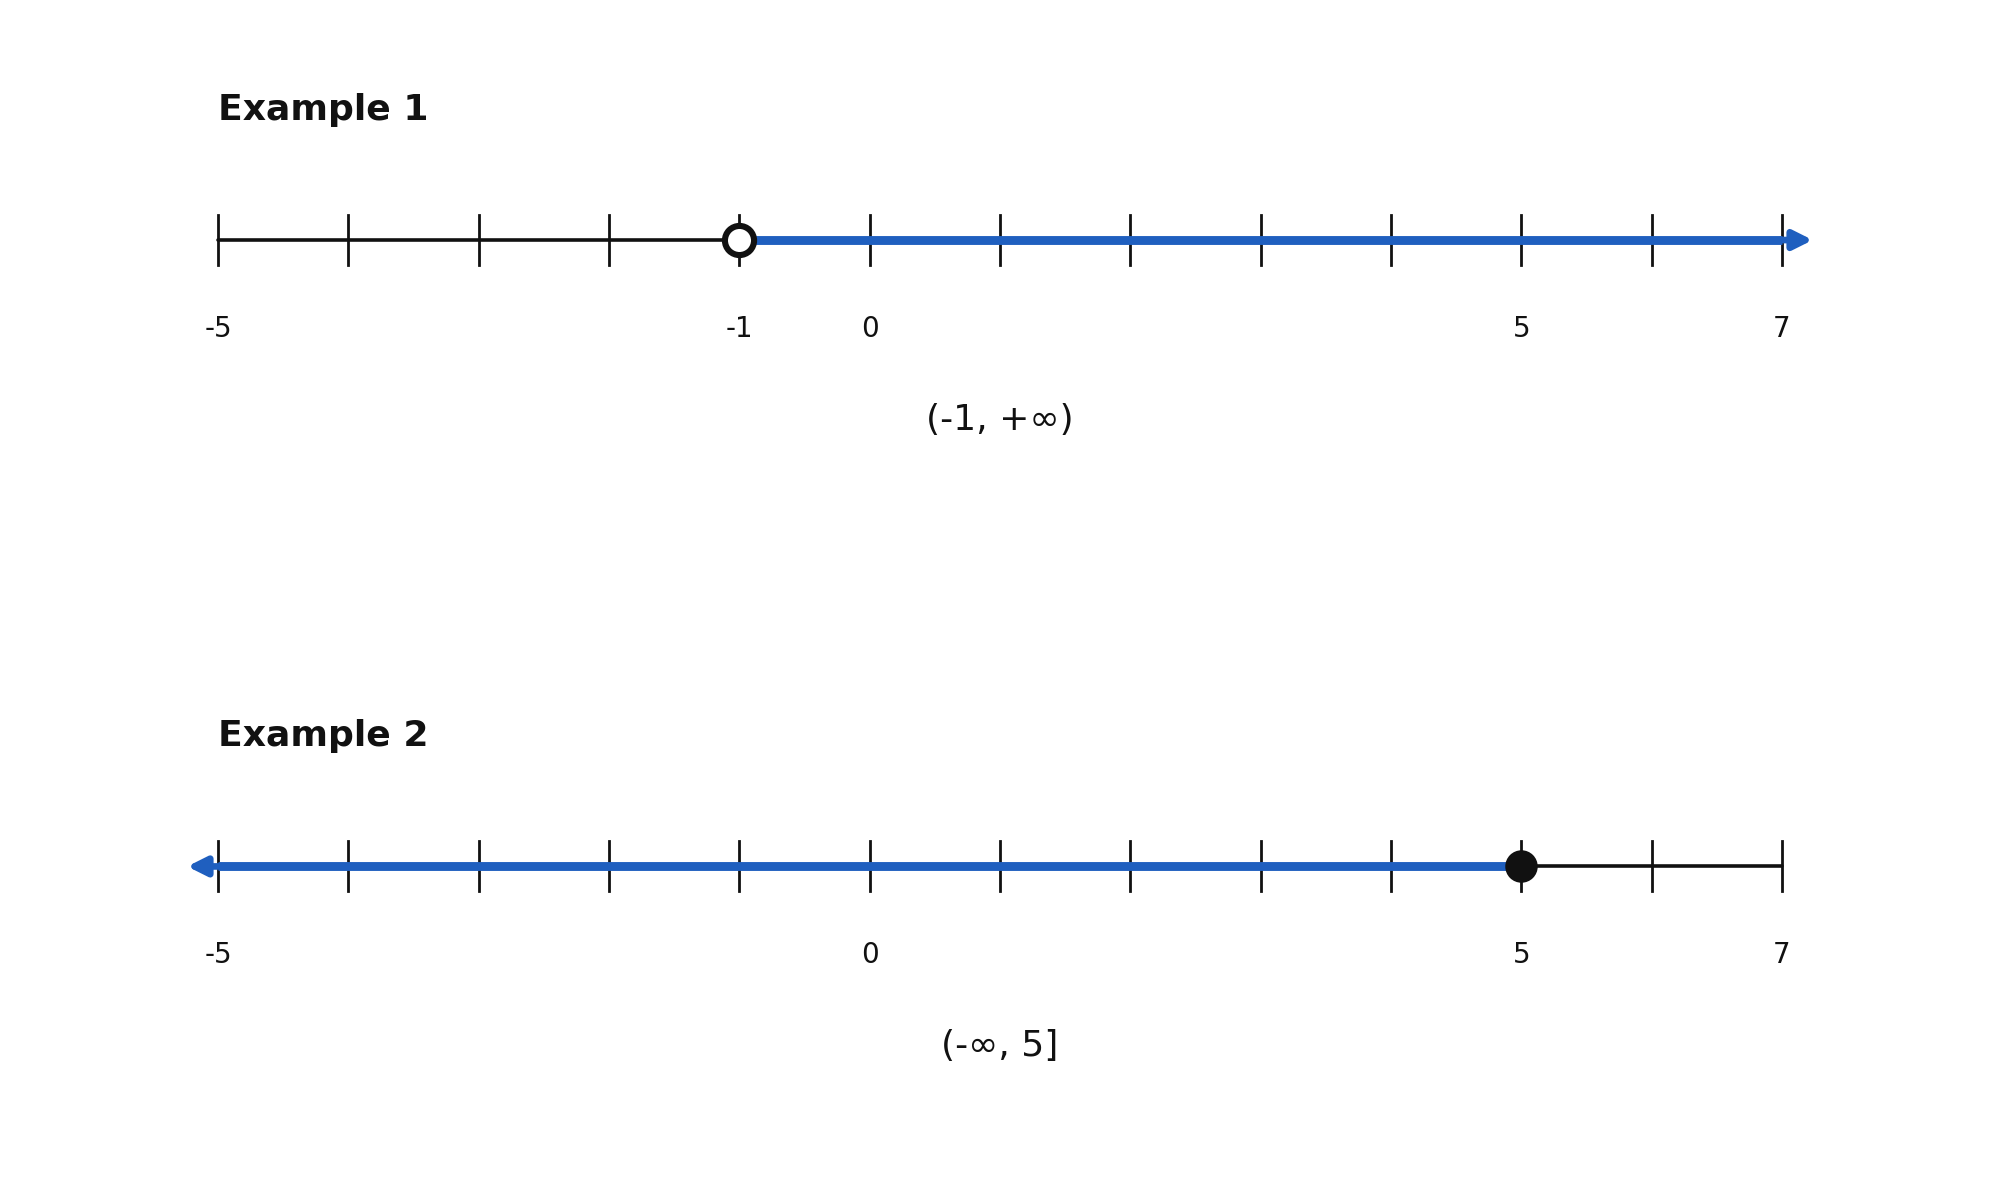
Example 1: Suppose we see an open circle at −1 with shading to the right. The endpoint −1 is excluded (open circle → parenthesis), and the shading goes toward +∞. The interval is:
(−1,+∞)
Example 2: Now picture a closed circle at 5 with shading to the left. The endpoint 5 is included (closed circle → bracket), and the shading goes toward −∞. The interval is:
(−∞,5]
Going in the reverse direction is just as straightforward. Given an interval, follow these steps:
Read each delimiter. A parenthesis means draw an open circle; a bracket means draw a closed circle.
Locate the finite endpoint on the number line and draw the correct circle there.
Shade toward infinity. If −∞ appears on the left of the interval, shade to the left. If +∞ appears on the right, shade to the right.
Notice that here you are constructing the graph: you decide the circle type, mark the endpoint at the right place, and choose which way to shade — there is no ready-made picture to pick from.
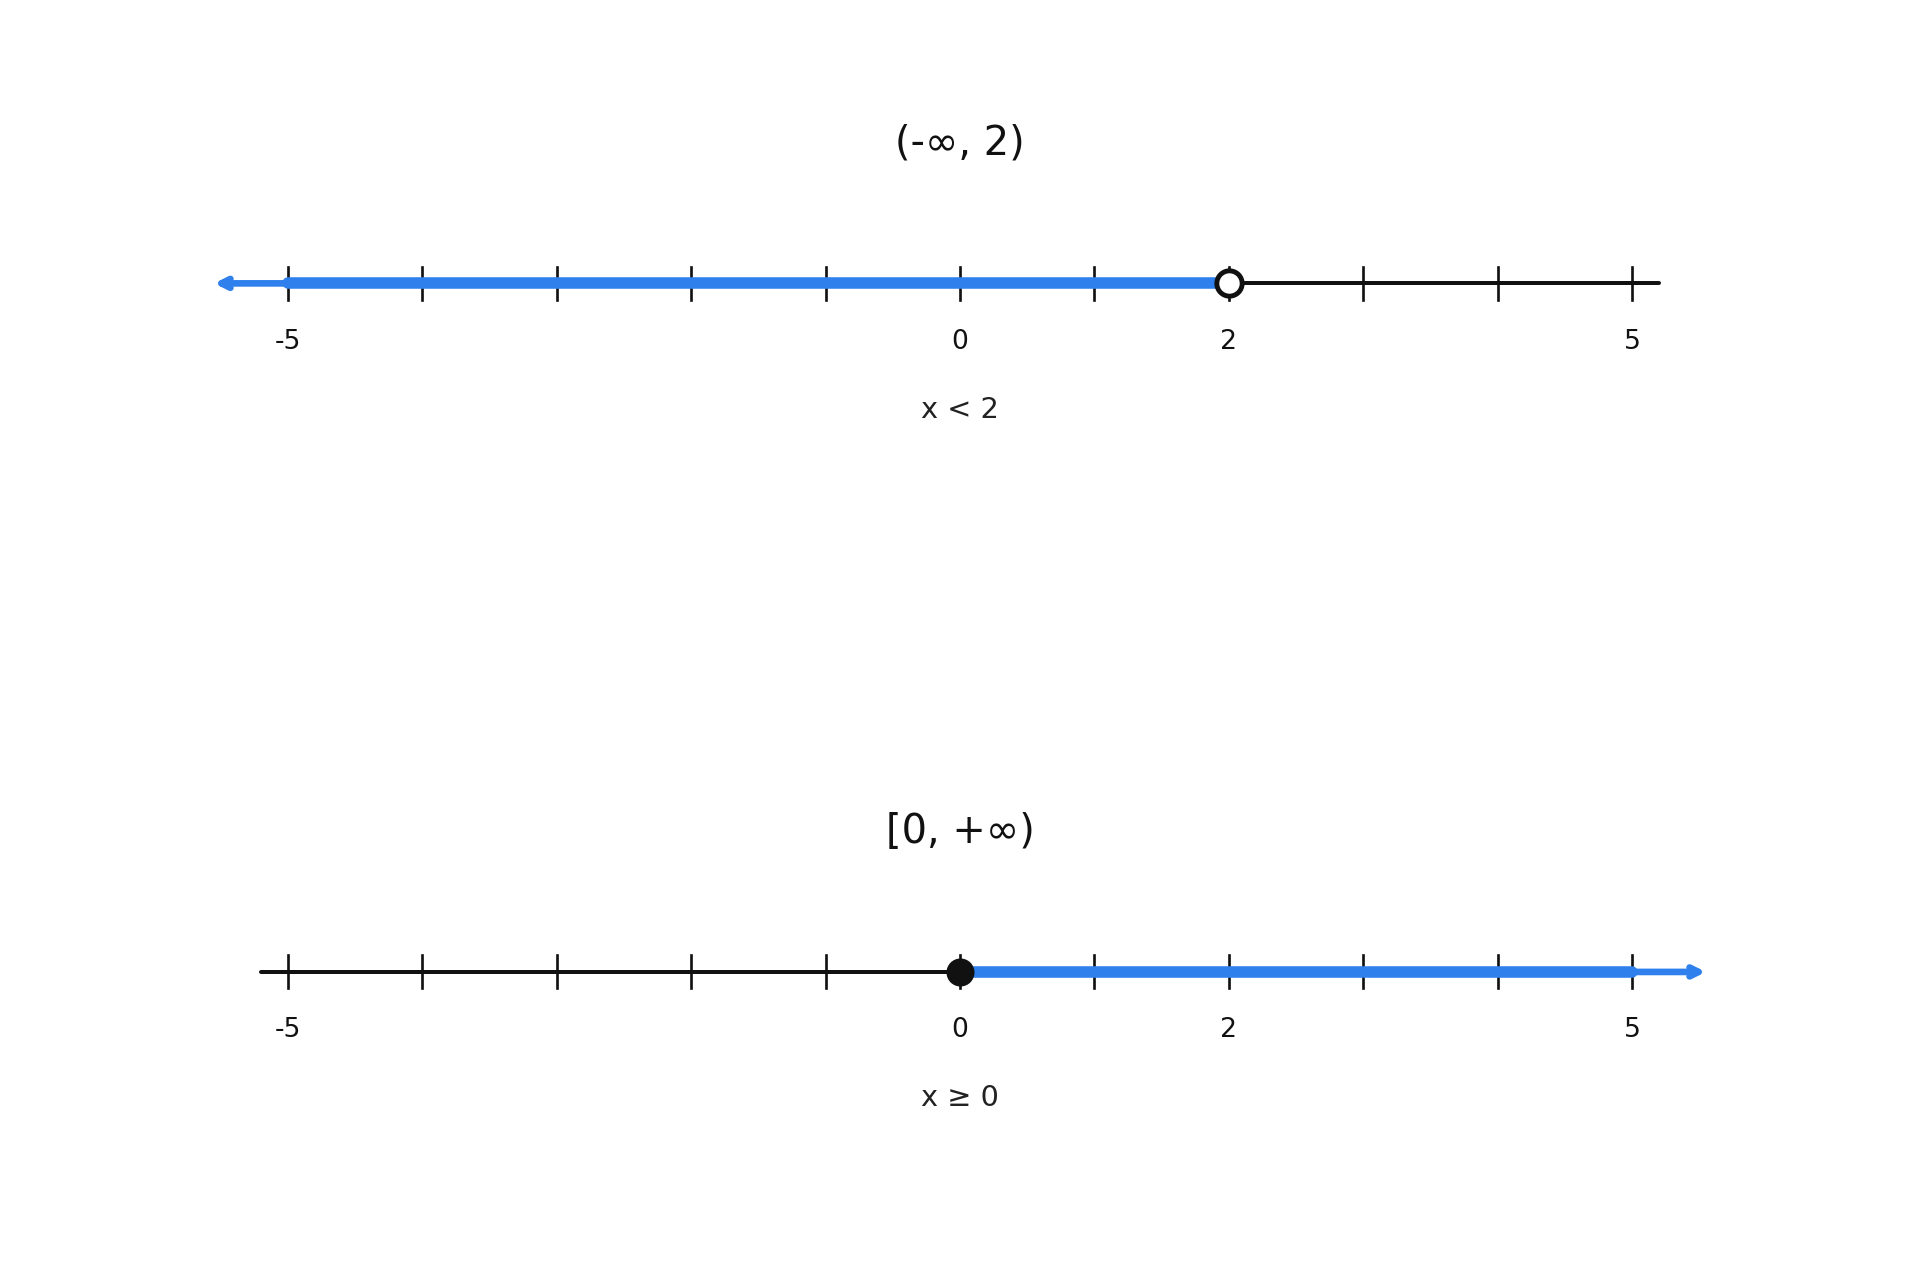
Example 3: Convert (−∞,2) to a number line. The finite endpoint is 2, paired with a parenthesis, so we draw an open circle at 2. Because −∞ is on the left side of the interval, we shade everything to the left of 2. This graph represents x<2.
Example 4: Convert [0,+∞) to a number line. The finite endpoint is 0, paired with a bracket, so we draw a closed circle at 0. Because +∞ is on the right side, we shade everything to the right of 0. This represents x≥0 — a range you might see in real life when describing quantities that cannot be negative, such as the length of a board or the time elapsed since an event.
Some solutions are bounded on both ends, such as −2≤x<3. On a number line, this means two endpoints instead of one: a closed circle at −2 (included) and an open circle at 3 (excluded), with the shading filling the space between them rather than running off toward infinity. In interval notation this is [−2,3).
To graph a bounded interval like [−2,3), work one endpoint at a time: read the left delimiter (bracket → closed circle at −2), read the right delimiter (parenthesis → open circle at 3), and then shade the segment connecting the two circles. Because both bounds are real numbers, no arrow is needed on either side.
Two special solution sets round out the picture:
All real numbers, written (−∞,∞). Every value is a solution, so the entire number line is shaded, with arrows pointing in both directions and no circles at all.
No solution, written ∅. No value works, so there is nothing to shade — the number line stays empty.
These cases look unusual, but the same reading rules apply: parentheses on both infinities for all real numbers, and an empty graph for the empty set.
A small slip in endpoint type can change the entire meaning of a solution. Here are the most frequent errors to watch for:
Mixing up circle types. The interval (−∞,4) requires an open circle at 4 because 4 is excluded. Accidentally drawing a closed circle would represent (−∞,4] instead — a different solution set entirely.
Putting a bracket on infinity. Writing [−∞,4] or [4,+∞] is incorrect. Since infinity is not a reachable value, it must always sit next to a parenthesis.
Shading the wrong direction. If the interval is (−∞,4), the shading goes to the left of 4, not to the right. Always check which side the infinity symbol appears on before you shade.
Forgetting the second endpoint. A bounded interval like [−2,3) needs two circles with shading between them; drawing only one loses half of the information.
In this lesson, we built a reliable two-way bridge between number-line graphs and interval notation. The core mapping is straightforward: open circles match parentheses, closed circles match brackets, and infinity always gets a parenthesis. We extended that bridge to bounded two-endpoint sets and to the two special cases — all real numbers, (−∞,∞), and no solution, ∅. With these rules in hand, you can move in both directions across all the cases we covered — one-sided rays, bounded two-endpoint sets, all real numbers, and the empty set — translating each graph to its matching interval and building the correct graph from any interval.
Up next, you will put these conversions into practice through a series of exercises. You will match graphs to intervals, fill in missing notation details, type interval notation from scratch, build a number-line graph on your own from an interval — including bounded sets and the two special cases, and verify whether a given graph correctly represents an interval. These tasks will sharpen your skill in both directions until the translations feel completely natural.