Recognize False Patterns and Coincidences
Introduction 🎉
Welcome to Recognize False Patterns and Coincidences! Over the first three lessons, you built a solid toolkit for evaluating chance. All of those lessons focused on sequences over time. Now you'll widen the view to patterns in space and across many comparisons. By the end of this lesson, you will have learned to:
- Recognize why randomness produces clusters and streaks that look far too tidy to be accidental, and explain why genuinely random data rarely matches our intuitions about what "random" should look like.
- Explain why coincidences become expected rather than miraculous once you account for the number of opportunities, using the birthday problem and the clustering illusion as guiding examples.
- Identify data dredging and the multiple comparisons problem, understanding why searching through enough variables almost guarantees an impressive-looking but hollow pattern.
- Apply practical evaluation questions about prediction, opportunities, mechanism, and replication to decide whether a striking pattern is meaningful or simply what chance looks like.
These skills are essential for clear thinking in a world full of data. By mastering these concepts, you will learn to pause before reading meaning into a striking pattern and recognize when an apparent signal is really just noise.
Human brains are built to detect patterns. That ability is enormously useful: it helps us learn languages, recognize faces, and spot real dangers. But the same wiring that picks up genuine signals also fires on random noise.
When you encounter a cluster of events or an unexpected coincidence, your first instinct is to look for a cause. The trouble is that randomness does not look the way most people expect it to. As you are about to see, truly random data is full of clumps, streaks, and surprises that can feel far too tidy to be accidental.
Clusters Hide Inside Randomness 🍇
When Coincidences Are Expected 🎂
Few things feel more meaningful than a striking coincidence. You think of an old friend for the first time in years, and minutes later they call. Two coworkers in a small office share the same birthday. These events feel rare because you evaluate them one at a time, but coincidences become almost inevitable once you account for the number of opportunities for something surprising to happen.
The birthday problem is the classic illustration. How many people need to be in a room before there is a better-than-even chance that at least two share a birthday? Most people guess around 180, reasoning that we need to cover roughly half of the 365 possible dates. The real answer is just 23.
Why so few?
The key insight is that you're not looking for one specific pair of people to match. You're asking whether any pair in the room shares a birthday. Imagine a room with just 5 people. Person A can be compared to 4 others. Person B can be compared to 3 new people. Person C can be compared to 2 more. Person D can be compared to 1 more. That would look like this:
- A–B
- A–C
- A–D
- A–E
- B–C
- B–D
- B–E
- C–D
- C–E
- D–E
Even with only 5 people, there are already 10 different pairs that could potentially match. As the group grows, the number of possible pairs grows much faster than the number of people. With 23 people, there are 253 different pairs that could produce a birthday match. Any one pair has only a tiny chance of matching. But when hundreds of possible pairs exist, the chances that at least one pair matches becomes surprisingly high. That is why a shared birthday feels like an amazing coincidence when it happens, yet becomes more likely than not in a group of 23 people.
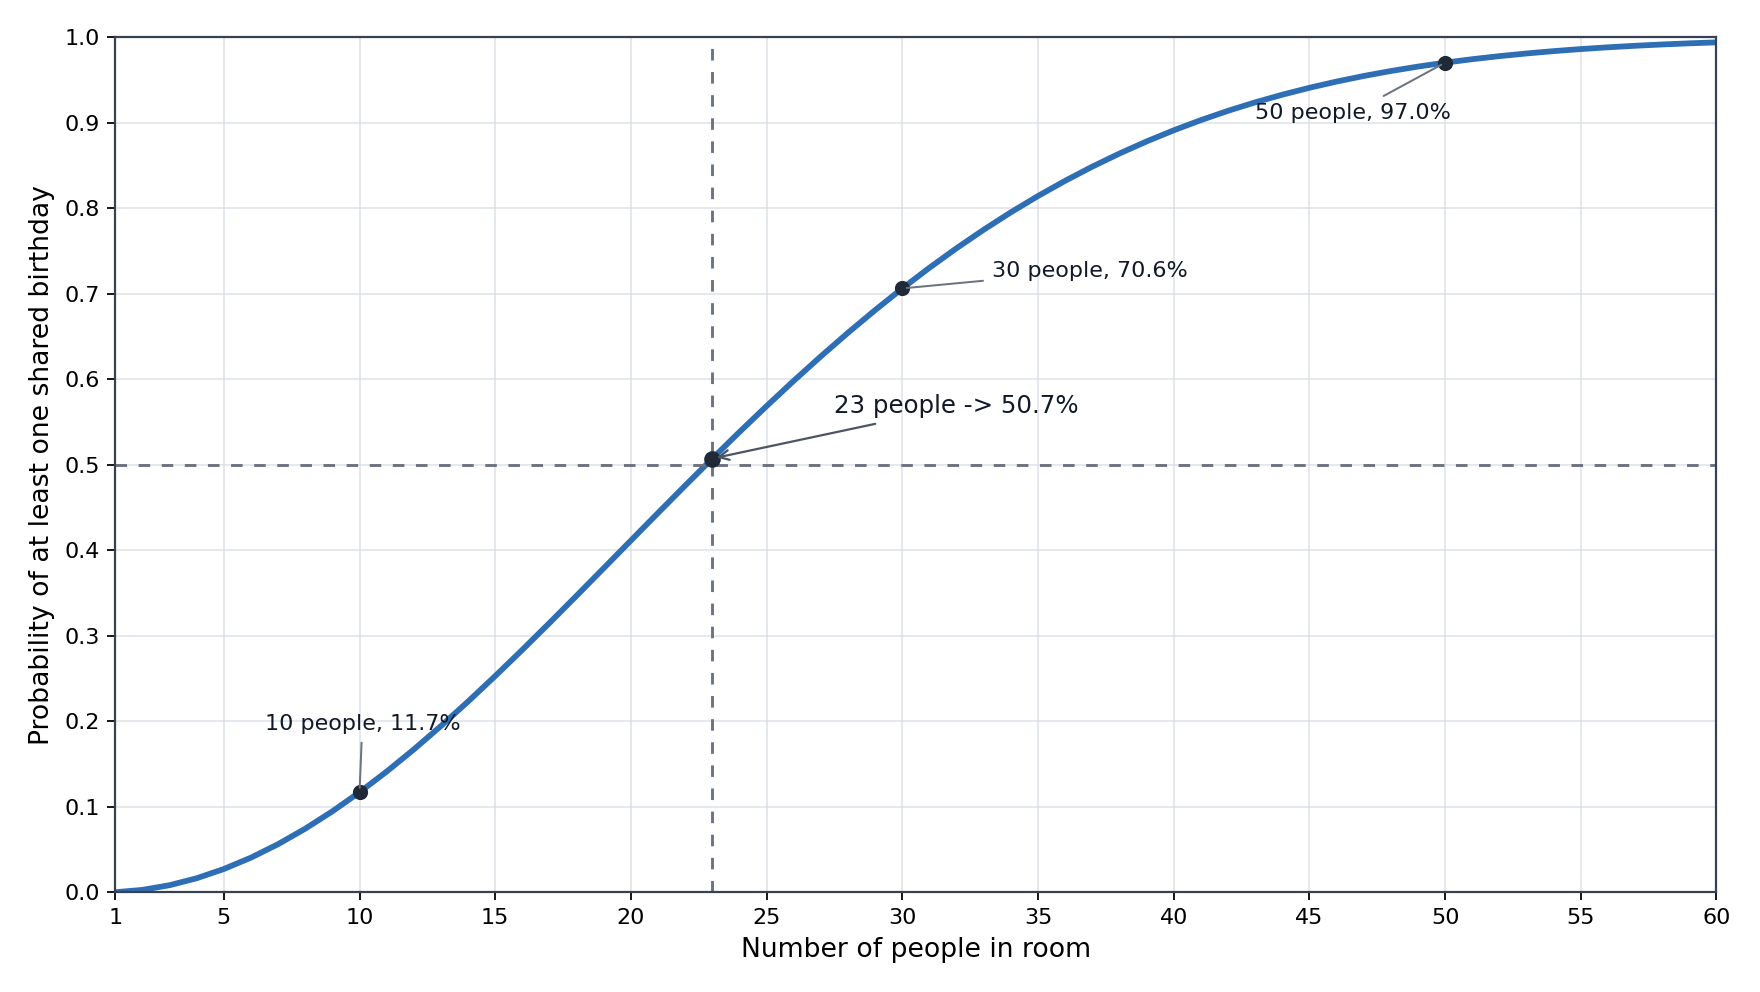
The deeper lesson goes well beyond birthdays. Whenever the number of possible comparisons is large, the probability that some surprising match or coincidence appears can be very high, even when the probability of any particular coincidence is tiny.
The Clustering Illusion 🗺️
The same logic applies to patterns in space and time. Imagine plotting where lightning strikes hit a region over a decade, or where crimes occur across a city. People often notice that certain spots seem to get hit repeatedly while others are spared, and suspect a hidden cause behind the "hot spots." But when analysts compare such patterns to what pure randomness would predict, the clumps usually match the random pattern almost perfectly. The apparent hot spots are simply clusters that random scattering naturally creates.
This phenomenon is called the clustering illusion: our tendency to see meaningful patterns in random groupings. It shows up in many everyday contexts:
- A map of disease cases shows a cluster near a factory, prompting fears of contamination.
- Several airplane incidents occur within the same month, leading to talk of a "dangerous period" for aviation.
- A store experiences three shoplifting events on the same day and suspects an organized ring.
In each case, the cluster might point to a real cause, but a cluster alone is not strong evidence. Random events scattered across time or space will form clumps by sheer chance. A perfectly even spread would actually be a sign that something non-random is at work.
The Danger of Searching for Patterns 🚨
Suppose you check 20 unrelated factors and flag anything that looks unusual at the 5% level. A 5% false-alarm chance sounds small for one test. But if you run many tests, you give chance many opportunities to fool you.
With 20 separate checks, it is more likely than not that at least one result will look interesting just by chance. In fact, the chance is about 64%.
| Number of patterns checked | Chance of at least one false alarm |
|---|---|
| 1 | 5% |
| 5 | About 23% |
| 10 | About 40% |
| 20 | About 64% |
| 50 | Over 90% |
This problem is sometimes called data dredging or the multiple comparisons problem. It describes what happens when someone searches through a large dataset after the fact, hunting for any interesting pattern. The Texas sharpshooter fallacy offers a vivid analogy: imagine someone firing randomly at the side of a barn, then painting a target around the tightest cluster of bullet holes and claiming to be an expert marksman. Drawing the target after seeing the data is very different from predicting the pattern in advance. Patterns discovered through extensive searching are not necessarily wrong, but they need extra scrutiny and independent confirmation before we should trust them.
Telling Chance Patterns from Real Evidence 🤔
Given everything you have covered, how do you decide whether a pattern deserves our attention? Here are four questions worth asking:
- Was the pattern predicted beforehand, or discovered after the fact? A prediction made before looking at the data carries far more weight than a pattern noticed after browsing.
- How many opportunities existed for a coincidence or cluster to appear? The more comparisons, locations, or time windows available, the less surprising any single cluster becomes.
- Is there a plausible mechanism? A cluster of illness cases near a known pollution source is more credible than the same cluster near an ordinary park, because the first has a concrete causal explanation to investigate.
- Has the pattern held up in new data? A result that replicates in a fresh, independent dataset is much stronger evidence than one that appeared only once.
No single question settles the matter on its own. But taken together, they help you separate the patterns that reward investigation from the patterns that reward a shrug.
Conclusion and Next Steps
In this lesson, you explored three ways that randomness tricks us into seeing meaning where none exists. Clusters appear naturally in random sequences and spatial layouts, coincidences become expected rather than miraculous once you appreciate the sheer number of opportunities for something surprising to happen, and data dredging shows that searching through enough variables virtually guarantees discovering an impressive-looking but hollow pattern. To guard against these traps, you outlined four evaluation questions: whether a pattern was predicted in advance, how many opportunities existed, whether a plausible mechanism supports it, and whether it holds up in new data.
Up next, the practice exercises will put your pattern-evaluation skills to work. You will generate random data and watch clusters form before your eyes, weigh real-world coincidences, inspect suspicious hot spots, and discover firsthand how tempting fake patterns become when you search hard enough for them. Dive in and see how sharp your new toolkit really is!
