Interpret Winning and Losing Streaks
Introduction 🎉
Welcome to Interpret Winning and Losing Streaks! So far, you have learned to interpret probability claims, distinguish independent from dependent events, see why short random sequences swing wide, and name the gambler's fallacy. Now you'll learn the opposite trend of thinking: instead of expecting a streak to snap back, people will expect it to keep going. In this lesson, you will learn to:
- Identify the hot-hand belief in diverse contexts, ranging from sports and investing to sales and academics, recognizing when recent success is mistaken for lasting change.
- Explain regression to the mean and why extreme results tend to drift back toward the average through the fading of random luck rather than any corrective "force."
- Distinguish genuine improvement from a lucky run by applying practical guidelines about sustained shifts, plausible causes, appropriate baselines, and the role of randomness in a domain.
These skills are essential for objective analysis. The instinct to assume a hot streak must continue is one of the most persistent cognitive biases, often leading people to invent causal stories where simple randomness is the better explanation. By mastering these concepts, you will learn to weigh a person's full track record against a handful of recent outcomes and recognize when an impressive run reflects real skill — and when it is merely good luck that will not carry forward.
The Other Side of Streak Thinking 🔄
The gambler's fallacy and the hot-hand belief are mirror-image mistakes. The gambler watches a streak and expects the pattern to flip; the hot-hand thinker watches a streak and expects the pattern to continue. Both reactions treat a short streak as strong evidence about what comes next.
Consider a basketball player who sinks five shots in a row:
- One fan says, "She is due for a miss," which is the gambler's fallacy.
- Another fan says, "She is on fire, bet on her making the next one!" This is the hot-hand belief.
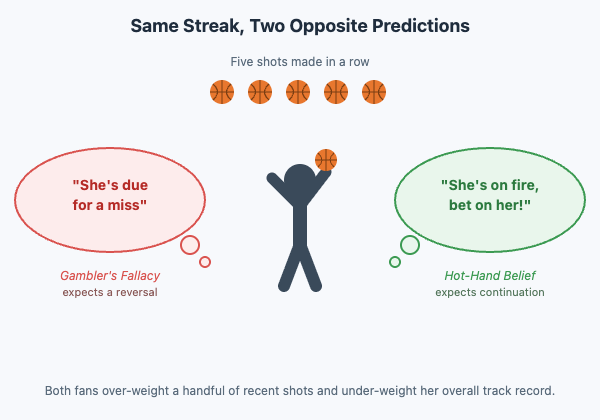
The hot-hand belief is the intuition that recent success raises the probability of future success. The name comes from basketball, where players and fans have long insisted that a shooter who has made several baskets in a row has a "hot hand." A famous 1985 study by psychologists Gilovich, Vallone, and Tversky examined actual shooting records and found that a player's probability of making the next shot was roughly the same regardless of whether the previous shots were hits or misses.
The hot-hand belief extends far beyond the basketball court:
- A mutual fund beats the market three years running, and investors rush to buy in, expecting more of the same.
- A salesperson closes five big deals in one month, and the manager projects an equally strong next quarter.
- A student aces one exam and assumes they have "figured it out" for the rest of the semester.
In every case, an exceptional short run is treated as proof that something fundamental has changed. Sometimes that conclusion is correct. Perhaps a new training routine really did make the player sharper, or the salesperson genuinely refined their pitch. But more often, the streak is a blend of genuine ability and a generous helping of good luck, and luck does not carry forward.
Why Extreme Results Are Rarely Pure Skill 🎯
Regression to the Mean 📉
The pattern just described has a formal name: regression to the mean. It states that extreme outcomes — whether exceptionally high or exceptionally low — tend to be followed by outcomes closer to the long-run average. The idea was first noticed by Sir Francis Galton in the 1880s, when he observed that very tall parents tended to have children who were tall but not quite as tall, and very short parents had children who were short but not quite as short.
A classroom example makes the pattern concrete. Suppose a group of students takes two versions of the same math exam. Each student's true ability stays constant between tests, but random variation (which topics appear, the testing environment, alertness that day) shifts each score up or down.
| Student | Test 1 Score | Test 2 Score | Direction of Change |
|---|---|---|---|
| Anna | 95 (far above average) | 84 | ↓ toward average |
| Ben | 58 (far below average) | 67 | ↑ toward average |
| Carlos | 76 (near average) | 74 | ≈ stable |
Anna's exceptional Test 1 score of 95 likely included a large positive random swing, meaning several lucky factors happened to line up on that particular day. On Test 2, that lucky combination did not repeat, so her score settled closer to her true level. This does not mean she did poorly on Test 2 — an 84 is still a strong score — it simply reflects the absence of the extra boost she happened to receive the first time.
Ben experienced the reverse: his low first score likely included some bad luck, and when that bad luck did not repeat, his score bounced back upward toward his true level.
Carlos started near the average, so he had little extra luck to lose or bad luck to recover from, which left him less room to move in either direction.
The key takeaway is that none of these students got smarter or less smart between tests. The movement in their scores is a statistical pattern driven by the role of randomness in extreme results, not a real change in ability.
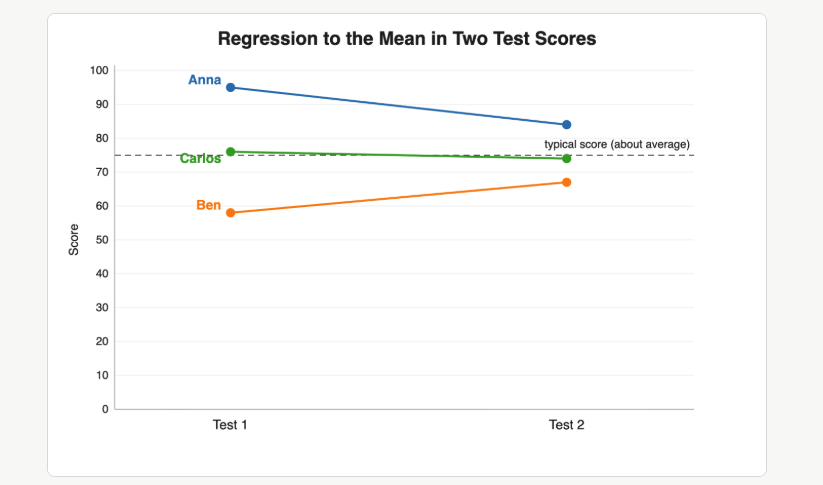
The slope graph above captures this idea visually. Scores that start far from the group average tend to drift back toward it on the second test, while scores near the average stay relatively stable.
One of the most common mistakes is treating regression to the mean as though it were a mysterious force that causes performance to change. But nothing actually pushes Anna's score down or pulls Ben's score up. Regression to the mean is not a force at all. It is just a description of what tends to happen when luck plays a role in results and you zoom in on the most extreme cases. Because extreme results usually got an extra push from good or bad luck, the next result tends to land closer to normal once that luck fades. Regression to the mean simply gives a name to this pattern.
This matters because people frequently invent causal stories where none are needed. Consider two common examples:
- A coach benches a player after a terrible game; the player performs better the next game, and the coach credits the benching.
- A magazine features a CEO after a record quarter; the following quarter disappoints, and readers blame a "cover jinx."
In both situations, regression to the mean offers a simpler explanation: extreme performances were already likely to be followed by more ordinary ones, no intervention required.
It is worth noting how regression to the mean differs from the gambler's fallacy. The gambler's fallacy claims that an independent process corrects itself on the very next trial, predicting that tails becomes more likely after a run of heads. Regression to the mean makes no such claim. It says that when you select the most extreme results from a group, the randomness that helped produce those results is unlikely to repeat at the same intensity. The process is not correcting; the luck is simply not persisting.
Real Improvement or Random Bounce? ⛹️
If extreme results naturally drift back toward the average, how do you tell whether someone has genuinely improved? Here are four practical guidelines:
- Look for a sustained shift, not a single spike. One great month could be luck. Six strong months with a clearly higher baseline is far more convincing.
- Identify a plausible cause. Did the person change their training, adopt a new strategy, or gain access to better tools? A concrete reason supports a genuine-improvement explanation.
- Compare against the right baseline. If a student's average over 20 exams rises from 72 to 80, that is more meaningful than a single 95 followed by a return to 72.
- Consider how much randomness the domain involves. In activities where luck plays a large role (investing, sales with few clients, single games), any one result carries a lot of noise, so regression will be stronger. In activities dominated by skill (chess ratings over hundreds of games), extreme results are more informative.
The goal is not to dismiss every streak as meaningless. It is to pause before assuming that a streak must reflect a lasting change and to ask whether regression to the mean could account for what we are seeing.
Conclusion and Next Steps
In this lesson, you explored two important ideas for interpreting streaks. The hot-hand belief tempts you to assume that a run of success will keep going, while regression to the mean reminds you that extreme performances tend to drift back toward typical levels because the random variation behind them rarely repeats. You also outlined four guidelines for separating genuine improvement from a lucky run: look for sustained shifts, plausible causes, appropriate baselines, and the level of randomness in the domain.
You now have two complementary lenses for evaluating streaks — one for the error of expecting reversal and one for the error of expecting continuation. Up next, the practice tasks will put these ideas to work with real-world scenarios involving hot streaks, slumps, and dramatic turnarounds, giving you a chance to sharpen your judgment.
