Two Conditional Directions
Introduction
Welcome back to Probability as a Degree of Belief! You have reached lesson four of five, so we are nearing the finish line for this course. In the first three lessons you learned to place beliefs on the -to- scale, distinguished belief-based probability from long-run frequency, and discovered how conditioning on evidence narrows your attention to a smaller, more relevant group. That toolkit is about to become even more powerful.
At the end of the previous lesson, we noticed something striking: and turned out to be two different numbers, even though both were built from the same overlap cell. In this lesson, we will dig into why reversing the direction of a conditional changes the result, see vivid examples where the two directions give very different answers, and learn to spot the surprisingly common mistake of swapping one for the other.
One Conditional, Two Readings
Recall that the vertical bar in means "given that is true." The item on the right side of the bar sets the stage — it defines the group we restrict our attention to. The item on the left is what we measure once we are inside that group.
Now consider two statements that sound almost the same:
- "The probability of rain, given that there are dark clouds."
- "The probability of dark clouds, given that it is raining."
The first, , asks: among all the times we see dark clouds, how often does it rain? The second, , asks: among all the times it rains, how often are there dark clouds? These questions look at different groups of moments, so there is no reason to expect the same answer.
In many real-world problems, one side of the conditional is a hypothesis — something we want to know about but cannot observe directly — and the other side is the evidence — something we can observe. For example, a disease is a hypothesis (hidden inside the body), while a test result is evidence (visible on a lab report). Keeping track of which role each piece plays, and which group sits in the denominator, is the single most important habit in conditional reasoning.
A Medical Test Example
Let's make this concrete with numbers. Suppose a city of 10,000 people has a rare disease that affects 50 of them. A medical test for the disease has two known properties:
- Among people who have the disease (the hypothesis is true), the test comes back positive 90% of the time.
- Among people who do not have the disease, the test comes back positive 5% of the time (a false alarm).
These facts give us two conditional probabilities right away:
Both of these are in the direction — they tell us how likely the evidence (test result) is under each version of the hypothesis (disease status). Now imagine someone receives a positive result and asks, "What is the probability that I actually have the disease?" That question flips the direction:
Many people instinctively answer "about 90%," because they recall that the test is "90% accurate." But that 90% belongs to the other direction — it is , not . Let's slow down and count.
Counting to See the Difference
We can lay out the full picture for our city of 10,000 people in a two-way table, just as we practiced in the last lesson.
| Positive Test | Negative Test | Total | |
|---|---|---|---|
| Has Disease | 45 | 5 | 50 |
| No Disease | 498 | 9,452 | 9,950 |
| Total | 543 | 9,457 | 10,000 |
Here is how the counts work:
- Of the 50 people with the disease, 90% test positive: .
- Of the 9,950 people without the disease, 5% test positive: .
Now we can answer the patient's question. The evidence is "positive test," so we restrict attention to the 543 people who tested positive. Among those, only 45 actually have the disease:
That is roughly 8%, not 90%. The two directions of the conditional give dramatically different results: the test's ability to detect the disease () is worlds apart from the chance that a positive result actually means disease ().
Why the Two Directions Diverge
The key insight is that the same overlap cell — 45 people — is being divided by two very different totals. A visual comparison helps make this clear:
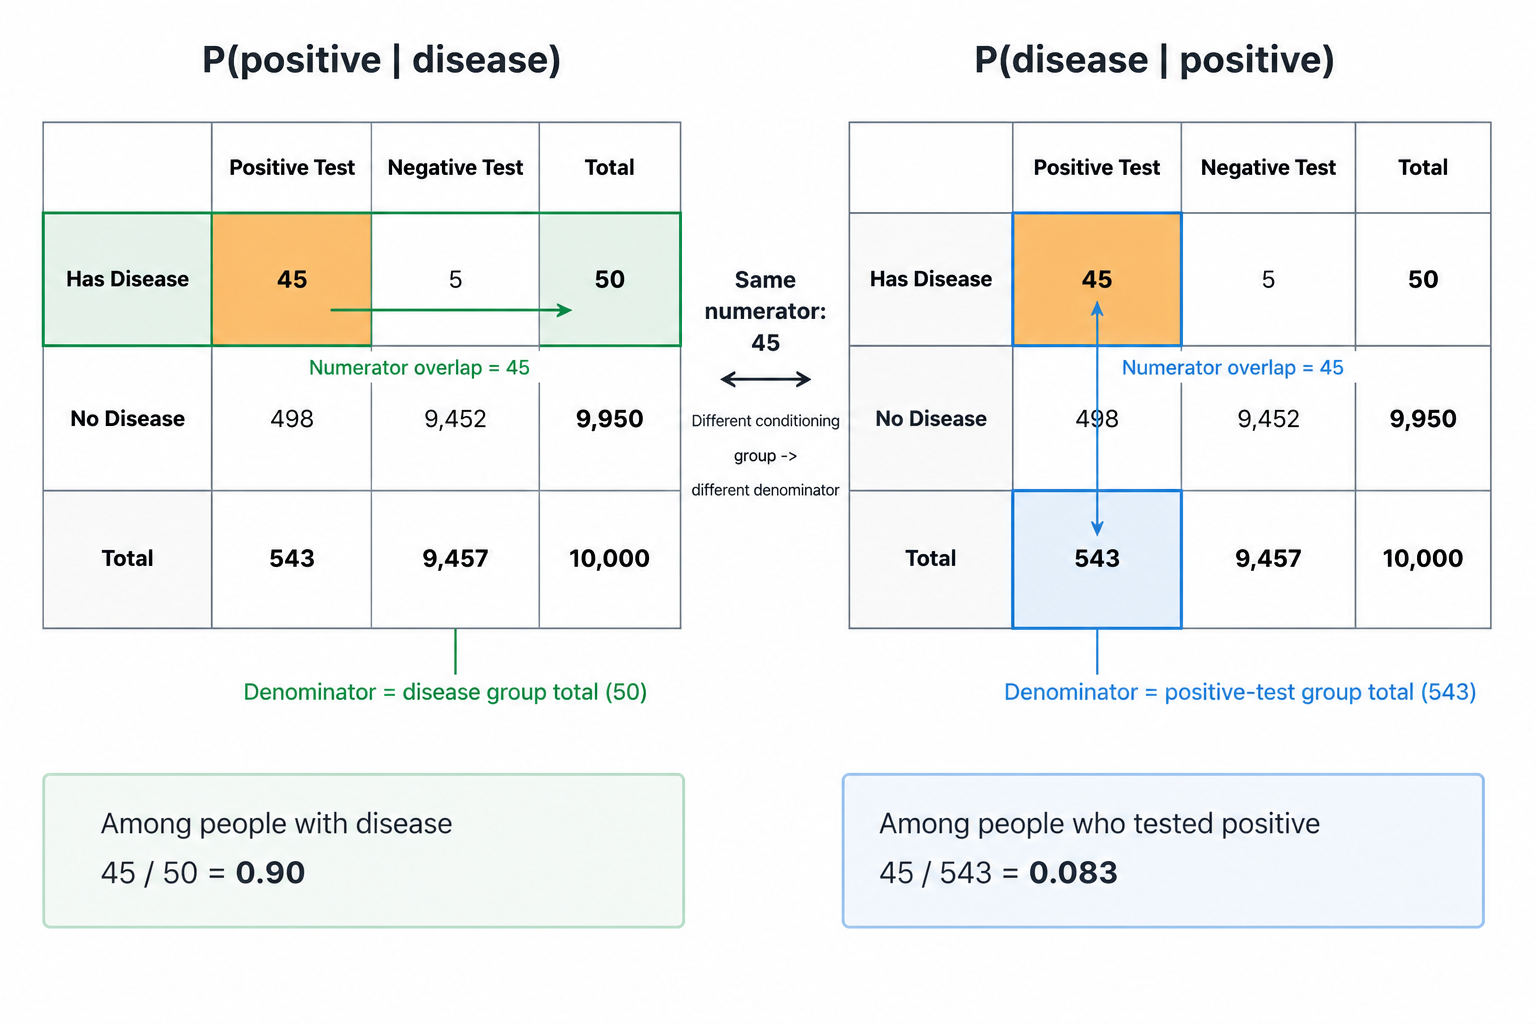
| Direction | Denominator (the "given" group) | Size |
|---|---|---|
| People with the disease | 50 | |
| People who tested positive | 543 |
When the disease is rare, the "has disease" group is tiny while the "tested positive" group is much larger, swollen by hundreds of false alarms from the healthy majority. Those false alarms dilute the true positives and drag far below .
In general, the two directions of a conditional will be equal only by coincidence. Whenever the sizes of the two "given" groups differ, the fractions will differ too, even though the numerator (the overlap count) is the same in both. The rarer the hypothesis, the wider the gap tends to be.
Swapping the Directions: A Costly Mistake
Treating as though it were is one of the most common reasoning errors in everyday life and in high-stakes settings alike. Let's look at two situations where this swap causes real harm.
Medical screening. In our test example, a patient who hears "this test catches 90% of true cases" might walk away believing there is a 90% chance they are sick after a positive result. Acting on that inflated belief could mean unnecessary anxiety, invasive follow-up procedures, or even unneeded treatment — all because 90% was read as the answer to the wrong question. The actual probability of having the disease was only about 8%.
Courtroom reasoning. Suppose a prosecutor argues: "The probability of finding this DNA match if the defendant were innocent is only 1 in 10,000. Therefore, the probability that the defendant is innocent is only 1 in 10,000." This swaps for . If the city has millions of residents, many innocent people could share that DNA profile, making the true probability of innocence far higher than . The logic error is exactly the same one we saw with the medical test: the "given" group changes, and ignoring that change distorts the conclusion.
Quick Guide: Identifying the Direction
When you encounter a probability statement written in everyday language, a reliable trick is to find the "among" group. The group that follows "among" or "of" is the given, or conditioning, group, and it belongs on the right side of the bar. In an evidence-versus-hypothesis example, that given group may be the hypothesis or the evidence, depending on the sentence.
| Plain-language statement | Symbolic form |
|---|---|
| "Among people with the flu, 60% have a fever." | |
| "Among people with a fever, 30% have the flu." | |
| "Of all spam emails, 80% contain the word free." | |
| "Of emails containing free, 40% are spam." |
Notice how flipping the "among" group flips the conditional — and often changes the number substantially. Whenever you are unsure of the direction, rewrite the statement using "among" and the correct placement becomes clear.
Conclusion and Next Steps
Every conditional probability has a direction: and share the same overlap but use different denominators, so they are generally not equal. The gap between them can be enormous when one "given" group is much larger than the other, and mistaking one direction for the other is a reasoning error that surfaces in medicine, courtrooms, and daily life with serious consequences.
Up next, you will put these insights to work in a set of hands-on exercises. You will label conditional directions from worded statements, match everyday phrases to their symbolic forms, explain in your own words why the two directions diverge, and analyze a high-stakes scenario where swapping them leads to a flawed conclusion.
